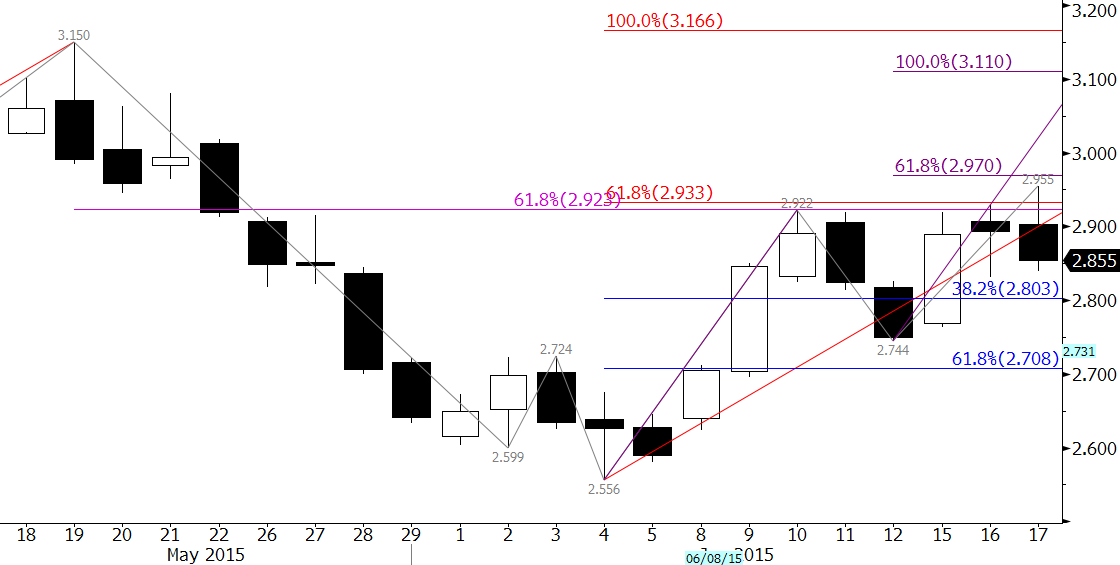
Last week we discussed the chart below and the importance of $2.92 as the 0.618 projection of the wave up from $2.54 (not shown) and the 62 percent retracement from $3.15. The chart is being shown again, with a few updates, because not much has changed over the past week.

The crucial $2.92 level has been tested four times now, including this morning’s brief excursion to $2.955. Because prices failed to close over $2.92 again, we expect to see another oscillation lower to challenge support at $2.80. This is the 38 percent retracement of the move up and is near Monday’s $2.83 midpoint and Tuesday’s $2.831 low.
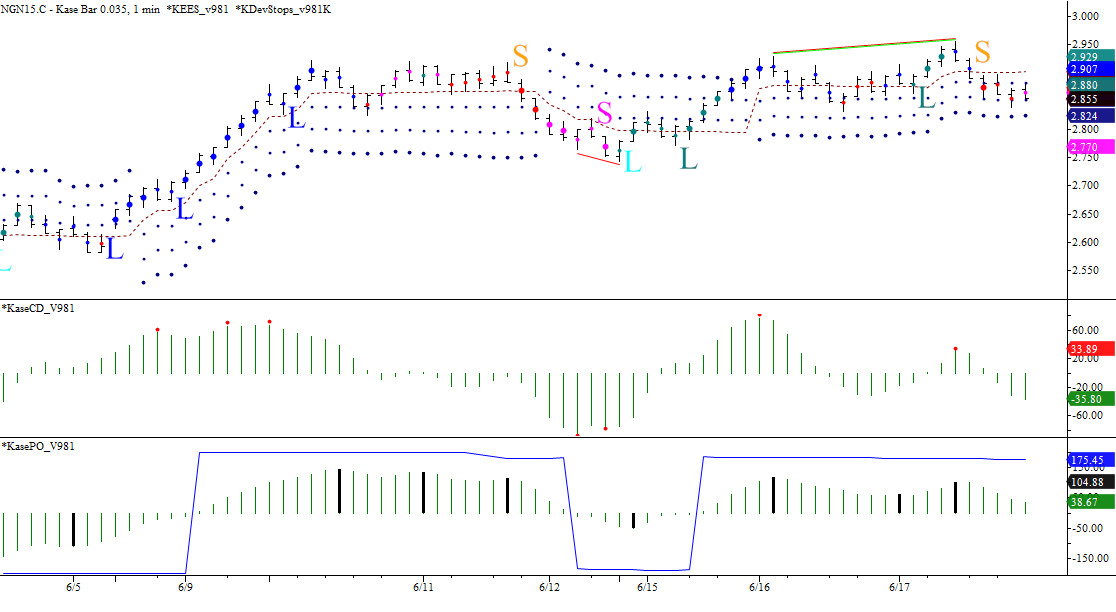
The bearish KaseCD and KasePO divergence and the DevStop2 hit on the $0.035 Kase Bar chart support the move lower and test of $2.80 tomorrow.

Tomorrow’s EIA may be the catalyst the market needs to either close over $2.92 or below $2.80. A close over $2.92 has strong bullish implications as discussed in our weekly natural gas forecast. A close back below $2.80 would call for another test of support and possibly the contract lows. For now, $2.92 and $2.80 are the levels to watch for clarification of the near-term, and possibly the longer-term, direction.
This is a brief analysis ahead of tomorrow’s EIA report. Our weekly Natural Gas Commentary is a much more detailed and thorough analysis. If you are interested, please sign up for a complimentary four week trial.

