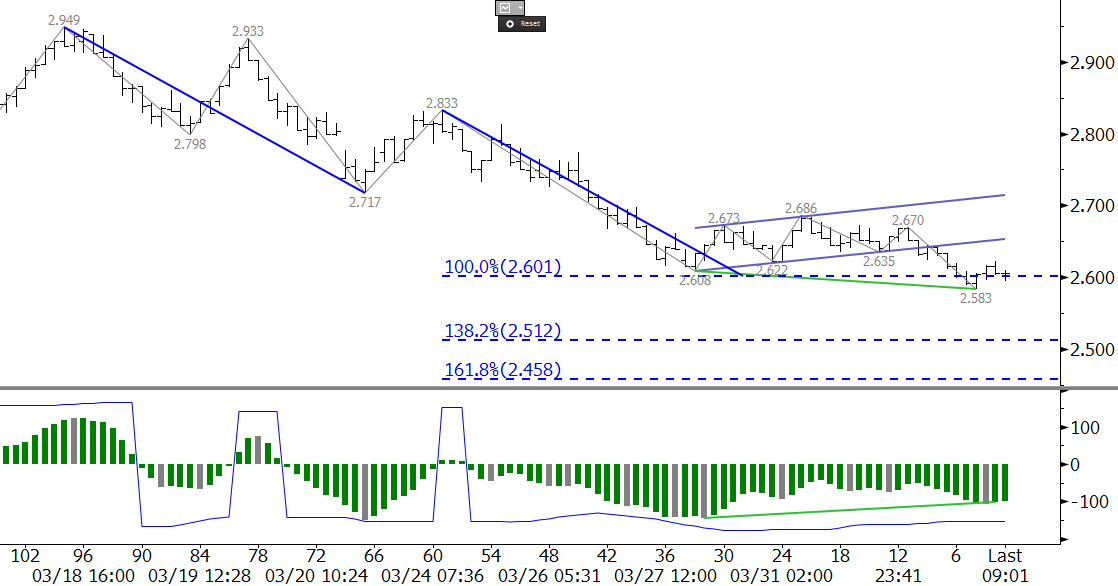
Natural gas had been supported by late winter weather in regions of the U.S. through late last week. However, as expected, natural gas prices finally broke lower out of the large scale corrective pattern that formed during the calendar month of March. The move down is poised to continue, but in the very short term, there may be a small pullback first.
The May futures contract broke out of another small bearish flag this morning on the 240-minute equivalent Kase Bar chart and fell to a new contract low of $2.583. This is an important area of support, and a potential short term stalling point because May’s $2.583 low is in line with the 1.00 target for the move down from $2.949 (as shown in the chart above), and is also near the continuation chart’s swing lows of $2.567 and $2.578. In addition, a bullish KasePO divergence (green trend line) was confirmed this morning.

All of these factors are positive for the very short term. They indicate that a pullback may take place ahead of tomorrow’s U.S. Energy Information Administration (EIA) Natural Gas Weekly Update. However, the longer-term technical and fundamental factors indicate resistance should hold and that the move down will extend. Once natural gas prices have definitively broken support between $2.57 and $2.60, look for $2.51 and $2.46, the latter of which is also the 0.618 projection of the compound wave $2.949 – 2.608 – 2.686.
Look for resistance at $2.65 to hold. This is the 21 percent retracement of the decline from $2.949 and is near the lower trend line of the small bearish flag that broke lower this morning. Even a pullback to $2.72, which is the 38 percent retracement, would be considered a normal correction. A close over $2.72 is doubtful without a bullish surprise from external factors.
Take a trial of Kase’s more in-depth weekly energy forecasts.

