By Dean Rogers
This is the time of year when everyone is looking for a bottom and pre-winter rally for natural gas. The logic and seasonal timing make sense, but picking bottoms is a dangerous game. Those that successfully time the bottom are more lucky than good. The best that most mere mortals can hope for is to be prepared for the turn so that they can react in an effective manner that fits their goals, strategy, and risk appetite.
This is why it is important to have a forecast and directional opinion (and yes, sideways is a direction) about the market in addition to a set of reliable indicators like Kase StatWare or KaseX to time entries and exits. The forecast is the framework for the market that lets you know where key support and resistance are and when you can expect correction and potential trend reversal. Indicators tell you when to get in, where to place stops, and when to get out.
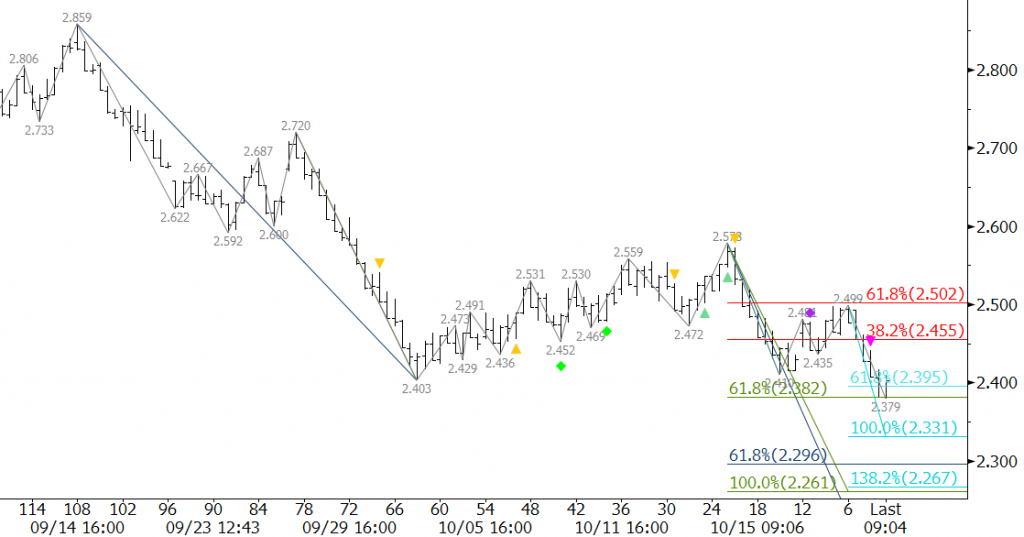
For instance, $2.40 was major support for November natural gas. This was a highly confluent target, and we had discussed this level as a potential stalling point for many weeks (even months) leading up to the decline to $2.403 on October 2. However, the subsequent move up was shallow, choppy, and corrective. Long trades could have been taken on shorter bar lengths during the corrective move up, but in our detailed weekly forecasts and mid-week blog updates we anticipated another decline and test of $2.40 because the market was struggling to overcome key resistance levels at $2.48 and $2.59.
November fell to $2.41 on October 16 and started to bounce again. The move stalled at $2.50 on Tuesday, October 20 and prices fell to new lows for November and the winter contracts on Wednesday, October 21.
$2.40 has held so far on a closing basis, but a sustained close below this level will open the way for at least $2.33, the 1.00 projection for the wave $2.578 – 2.41 – 2.499 and very likely $2.27. The latter is a confluent objective for the waves down from $2.859, $2.72, and $2.578 making it the next potential point at which a bottom could be made.
Most technical factors are negative and there is little evidence that the decline is going to stall. However, the importance of support at $2.33 and especially $2.27 indicate that we should be prepared for at least another correction and a potential bottom soon. Keep a close eye on your indicators to tell you when to time your entries and watch for closes above key resistance levels to confirm the move down has ended.
For now, initial resistance is $2.45 and key resistance, for the near term, is $2.50.
This is a brief natural gas forecast ahead of tomorrow’s EIA report. Our weekly Natural Gas Commentary is a much more detailed and thorough analysis. If you are interested in learning more, please sign up for a complimentary four week trial.


One thought on “Natural Gas Forecast: Looking for a bottom? So is everyone else.”