By Dean Rogers
As discussed last week, everyone is looking for the natural gas bottom. I am sure no one wants me to step back onto my “picking bottoms is a dangerous game” soap box, so I will just reiterate that the best anyone can do is identify potential turning points and look to time entries and exits that fit their trading style, risk appetite, and goals.
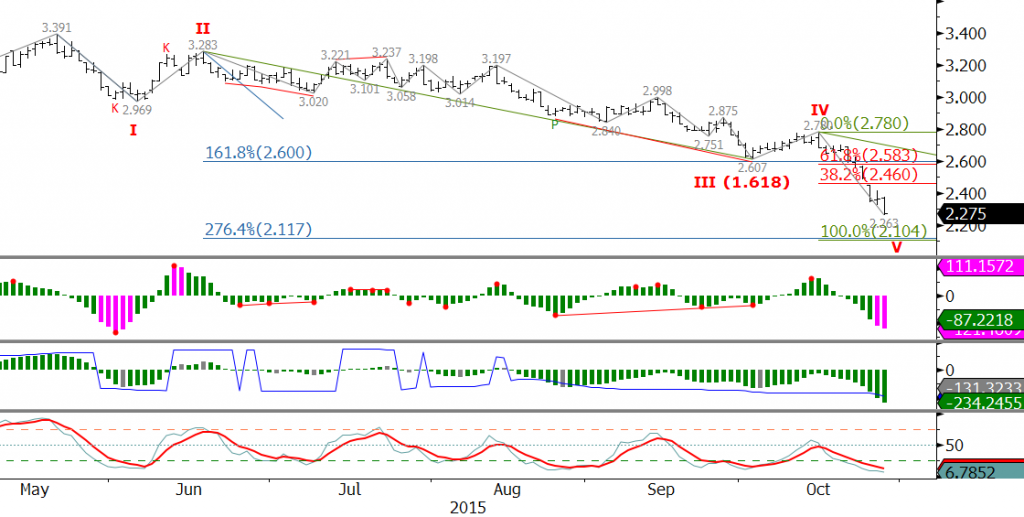
With that in mind, let’s discuss the potential turning points for natural gas at today’s $2.263 swing low and at $2.11, the latter of which I think is the most likely point for a bottom to be made.
December’s wave structure down from $3.391 has unfolded in a five-wave pattern. We are not Elliott Wave fanatics or strict practitioners, but when a textbook pattern forms we pay attention.
Below are some of the basic Elliott Wave rules we abide by and look for when a five-wave pattern forms.
Basic Elliot Wave Rules, according to Kase:
- A five-wave pattern is made up of three impulse waves and two corrective waves
- Two of the three impulse waves should be equal in size
- The impulse waves, labeled I, III, and V, should break down into five sub-waves.
- Wave III cannot be the smallest impulse wave
- Waves I, III, and IV should be proportional to one another (0.618, 1.00, 1.382, 1.618, etc.)
For the five-wave pattern down from $3.391 wave I met its 1.618 projection at $2.607 (end of wave III) and trend terminus (2.9693/3.3912) at $2.263 (potential end of wave V). The lowest that wave I projects is $2.12 as the 2.764 extension.
Given the importance of $2.263, the ticks up after the close, and oversold conditions on the KasePO, KaseCD, and slow stochastic, prices might turn higher from this level.
However, at this point there are not two equal waves. At $2.36 waves I and V were equal, but prices fell to $2.263. At $2.10 waves III and V will be equal. Therefore, based upon the basic Elliott Wave Rules, December will likely fall to the confluence point of $2.11 where wave I will have met its 2.764 projection and waves III and V will be equal.
From $2.11 we would expect to see a three-wave correction, and because of the time of year, a significant rally as the market heads into the winter heating season. A sustainable rally will be confirmed by a KasePO PeakOut, KaseCD KCDpeak, and %K over %D crossover as momentum rises out of oversold territory on the slow stochastic.
There are no guarantees that $2.11 will hold over the course of the longer-term, but this has become the most likely point at which a bottom will be made.
This is a brief natural gas forecast ahead of tomorrow’s EIA report. Our weekly Natural Gas Commentary is a much more detailed and thorough analysis. If you are interested in learning more, please sign up for a complimentary four week trial.


2 thoughts on “Natural Gas Forecast: December’s Wave Structure Calls for $2.11”