S&P 500 Index (SPX)
By Dean Rogers
The slowing Chinese economy, lackluster manufacturing data, and a weaker yuan have sent Chinese stocks tumbling in the first week of 2016. China’s stock market has been halted twice this week when volatility limits were reached and is down seven percent over the last few days. The selloff has spilled over into global markets as the Dow Jones Industrial Average and S&P 500 Index are off to their worst starts for a year ever.
The S&P 500 Index (SPX) charts reflect the near-term negative tone. Several factors indicate the decline should challenge support levels below August’s 1867.01 low at 1842. This will be a crucial decision point for a much more bearish outlook and sustained decline over the next several weeks and possibly months.
The table below shows SPX targets and resistance levels and the associated probabilities for meeting those targets and levels within the next 10 trading days. Kase’s technical forecasting models indicate odds are 80 percent for at least 1900 and 65 percent for 1842. The latter is the bearish decision point and will probably hold, at least initially.

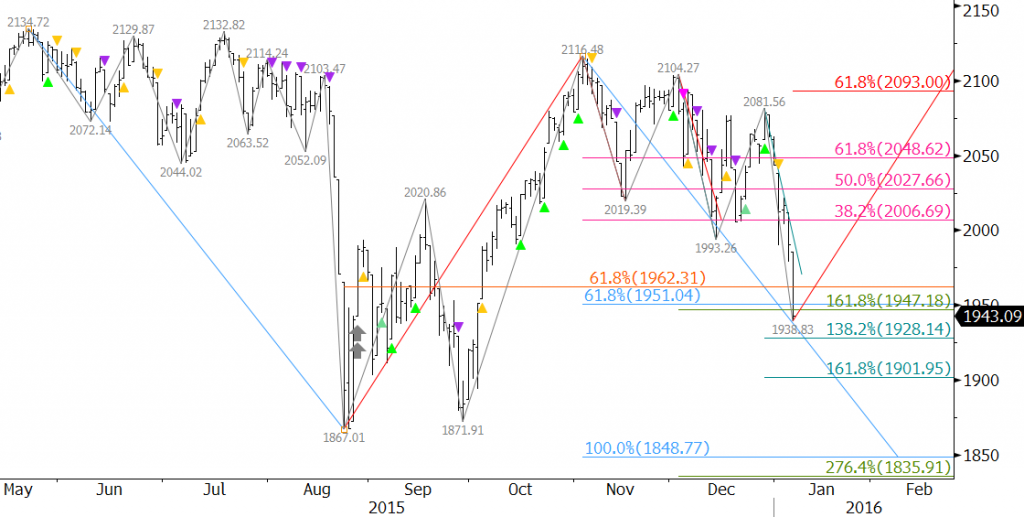
January 7’s close below the 62 percent retracement of the move up from 1867.01 to 2116.48 has shifted odds in favor of a continued decline. In addition, the 0.618 projection of the primary wave 2134.72 – 1867.01 – 2116.48 has been taken out by January 7’s close. Waves that close below the 0.618 projection generally extend to at least the 1.00 projection, in this case 1842 (+/- 7 points). Therefore, the SPX should fall to 1842 before a significant upward correction takes place. A close below 1842 would call for 1744 as the 1.382 projection for the wave down from 2134.72 with an intermediate confluence point at 1788.
SPX Daily with KaseX
First resistance is 2006, the 38 percent retracement of the decline from 2116.48 to 1938.83. This level will most likely hold upon a correction. The key level for the near term is 2048, the 62 percent retracement. A close over 2048 would indicate the move down is most likely over and that the SPX will push towards at least 2093 which connects to 2184. A close over 2048 has 35 percent odds and a close over 2093 has 20 percent odds.
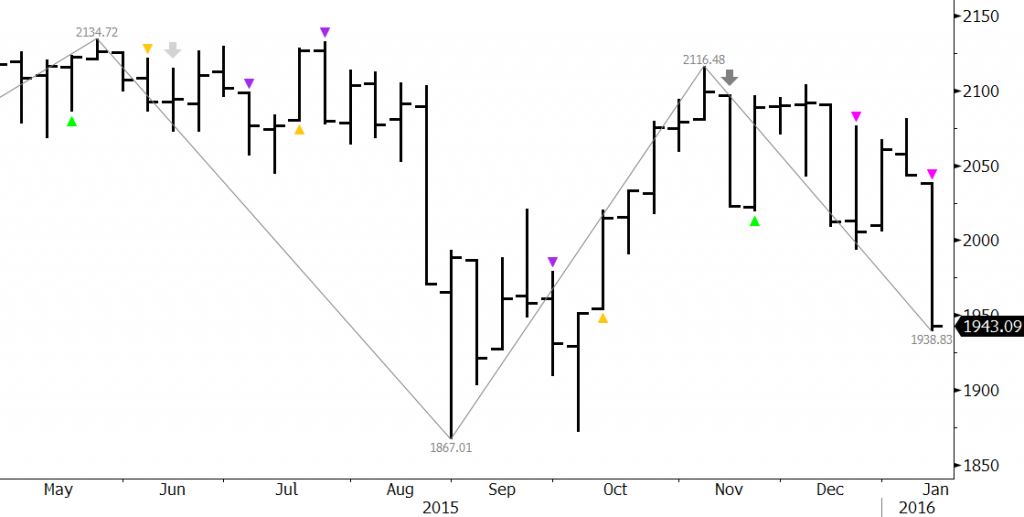
KaseX confirms the move down on the weekly chart. The recent overbought signal (gray arrow) and unfiltered short entries (pink triangles) indicate the decline should continue. On the daily chart, for those that are not already short, KaseX shows that it would be prudent to wait for a pullback and another confirmed sell signal (pink or purple triangle) after the recent short warning (yellow triangle).
SPX Weekly with KaseX
With all factors considered, the move down should continue and test the 1842 decision point in coming weeks. There is not enough technical evidence yet to definitively state that 1842 will hold. However, because of its importance, at a minimum, we expect at least a small upward correction to take place from 1842 once this target is met. Sustaining a close below 1842 would be extremely bearish for the long-term and could be the precursor to a bearish 2016.
This is a brief technical analysis of the S&P 500 Index based upon Kase’s technical forecasting models and trading indicator KaseX. If you are interested in taking a trial of KaseX please contact sales@kaseco.com. We would love to get your thoughts about the forecasted targets and probabilities. Leave a comment or send them along with your request for a trial to sales@kaseco.com.


One thought on “Kase Forecast of the Week – S&P 500 Index”