Gold Price Forecast
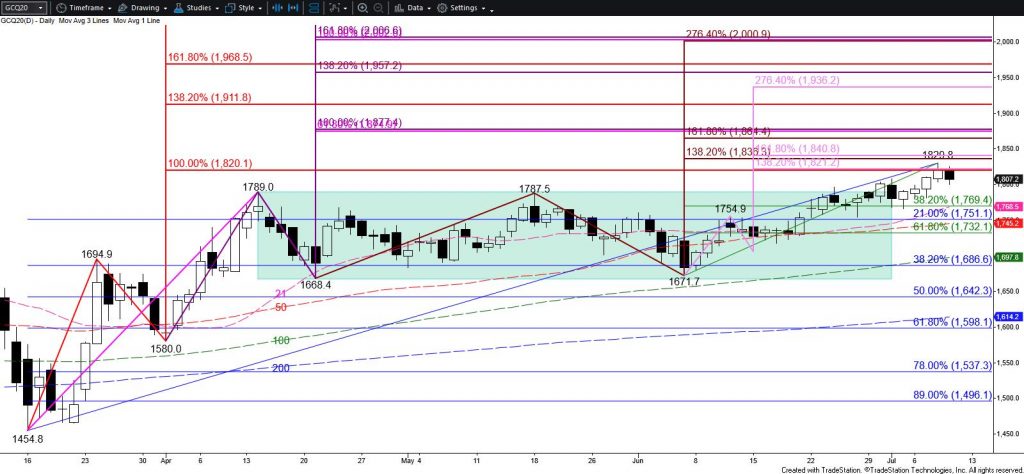
Gold finally broke higher out of the rectangle pattern that began to form in mid-April. A sustained close above $1790 confirmed the break high and the next objective around $1820 has already been met. The move up stalled at $1829.8, and today’s decline suggests a test of the $1790 breakout point might take place before the move up continues. A throwback to the breakout point of a pattern like a rectangle is common. Therefore, $1790 is expected to hold.
The long-term outlook for gold remains bullish and a close back above $1820 will clear the way for $1836 and higher. The next major objective above $1820 is $1912. This is a highly confluent wave projection and is in line with the rectangle’s $1909.6 target ($1789 + ($1789 – $1668.4) = $1909.6).

Should gold close below $1790, odds for a continued rise during the next few days will be significantly dampened. Key near-term support is $1770. Settling below $1770 would reflect a bearish shift in sentiment and imply that the recent move above $1790 was a false break higher out of the rectangle pattern.
This is a brief analysis for the next day or so. Our weekly Metals Commentary and daily updates are much more detailed and thorough energy price forecasts that cover key COMEX precious metals futures contracts and LME Non-Ferrous (Base) metals, spot gold, the gold/silver ration, and gold ETFs. If you are interested in learning more, please sign up for a complimentary four-week trial.


