Gold Price Forecast
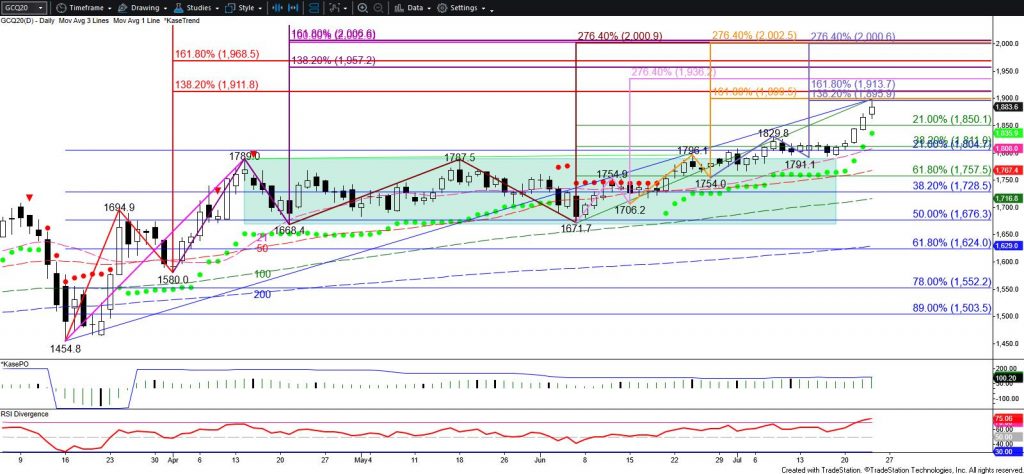
Gold’s move up finally accelerated this week after breaking higher out of a rectangle pattern on June 30 and then a throwback to test the $1790 breakout point on July 14. The move up has easily overcome targets around $1840 and $1871 this week but stalled this afternoon near $1898. Based on the wave structure, $1898 is a relatively minor target, and odds still favor a move above this to the next major objective at $1912. The $1912 objective is most important because it is the intermediate target of the first wave up from $1694.9 and is in line with the rectangle’s $1909.6 target ($1789 + ($1789 – $1668.4) = $1909.6). Therefore, once $1912 is met another modest test of support is expected before the move up continues.

There are no confirmed bearish reversal patterns or signals that call for a major test of support before reaching $1912. Nevertheless, the daily RSI and KasePO momentum oscillators have risen into overbought territory. This warns that a test of support will probably take place soon and suggests that $1912 will hold, at least initially.
The small move down from the $1898 confluence point also warns that a small test of support might take place before gold reaches $1912. Support at $1872 is expected to hold and $1853 is key for the near-term. Settling below $1853 would call for $1831 and possibly $1808 before gold rises toward $1912 again.
This is a brief analysis for the next day or so. Our weekly Metals Commentary and daily updates are much more detailed and thorough energy price forecasts that cover key COMEX precious metals futures contracts and LME Non-Ferrous (Base) metals, spot gold, the gold/silver ration, and gold ETFs. If you are interested in learning more, please sign up for a complimentary four-week trial.


