Gold Price Forecast
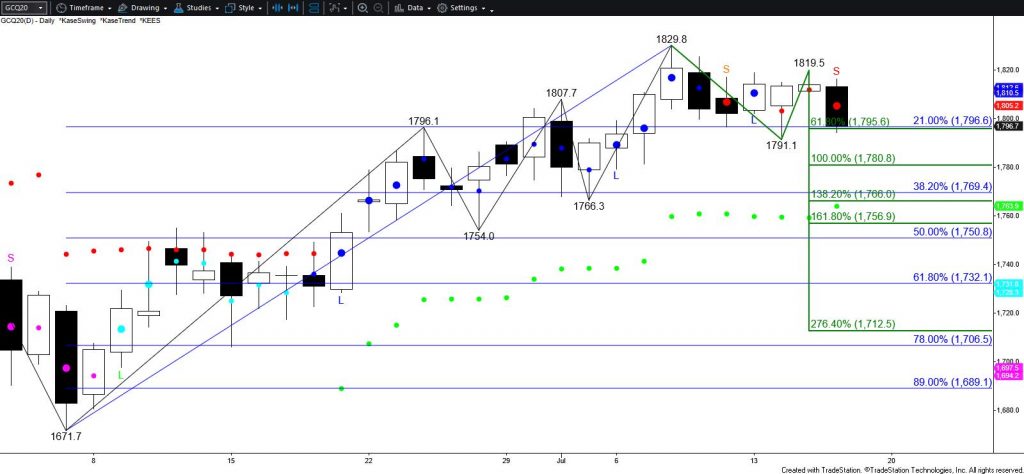
Gold’s move up has been lackluster after breaking higher out of a rectangle pattern on June 30. The move up fulfilled an important target at $1820, but since then, a throwback to test the breakout point of the rectangle around $1790 has taken place. Throwbacks are common and on Tuesday the correction down from the $1829.8 swing high stalled at $1971.1. However, the subsequent move back up stalled at $1819.5 and today’s price action fulfilled the smaller than (0.618) target of the wave down from $1829.8. Therefore, near-term odds favor a test of at least $1781 and possibly $1767 before the move up continues. There are the equal to (1.00) and intermediate (1.382) targets of the wave down from $1829.8, respectively.

Support at $1767 is also in line with the 38 percent retracement of the rise from $1671.1. This target is expected to hold. Settling below $1767 will significantly dampen odds for a continued rise to target above $1820 during the next few weeks. This will also clear the way for $1753 and possibly a test of key lower support at $1732.
Conversely, the long-term outlook remains bullish, so once $1781 is met odds for another test of $1820 will begin to increase. Settling above $1820 will open the way for the next leg of the move up to $1837 and higher.
This is a brief analysis for the next day or so. Our weekly Metals Commentary and daily updates are much more detailed and thorough energy price forecasts that cover key COMEX precious metals futures contracts and LME Non-Ferrous (Base) metals, spot gold, the gold/silver ration, and gold ETFs. If you are interested in learning more, please sign up for a complimentary four-week trial


