Natural gas has finally showed some signs of life over the past few days in anticipation of tomorrow’s U.S. Energy Information Administration (EIA) Natural Gas Weekly Update. The short-term charts are showing that traders are anticipating a bullish EIA report, which would be the support the market needs to continue this upward correction. Keep in mind though, this is a correction, and it will likely be predominant in the winter month contracts and short-lived without continued support from external factors.
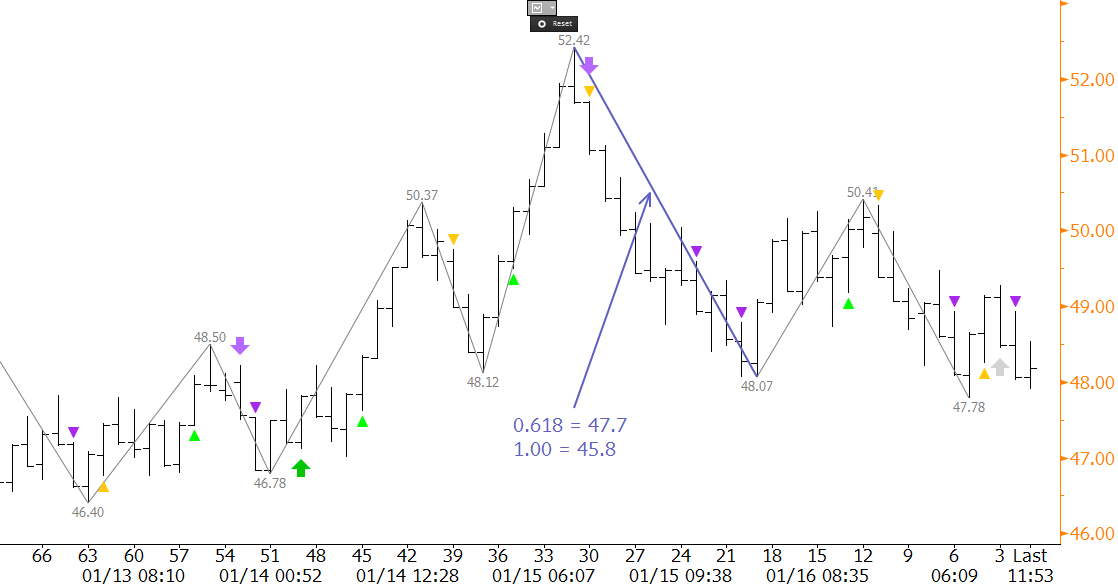
After oscillating in a sideways range between approximately $2.79 and $3.00 for the past six trading sessions, the February futures contract rose above $3.00 on Wednesday. This is near the $3.176 to $2.783 midpoint of $2.98, which is significant because this is also in line with the 0.618 projection of the irregular wave $2.803 – 3.176 – 2.783. The $1.00 projection of this wave was overcome at $3.15, and the 1.618 projections is $3.38. The $3.38 level is important because it is the 50 percent retracement from $3.95 to $2.783. This level will likely be met, and possibly overcome, upon a bullish EIA number tomorrow.
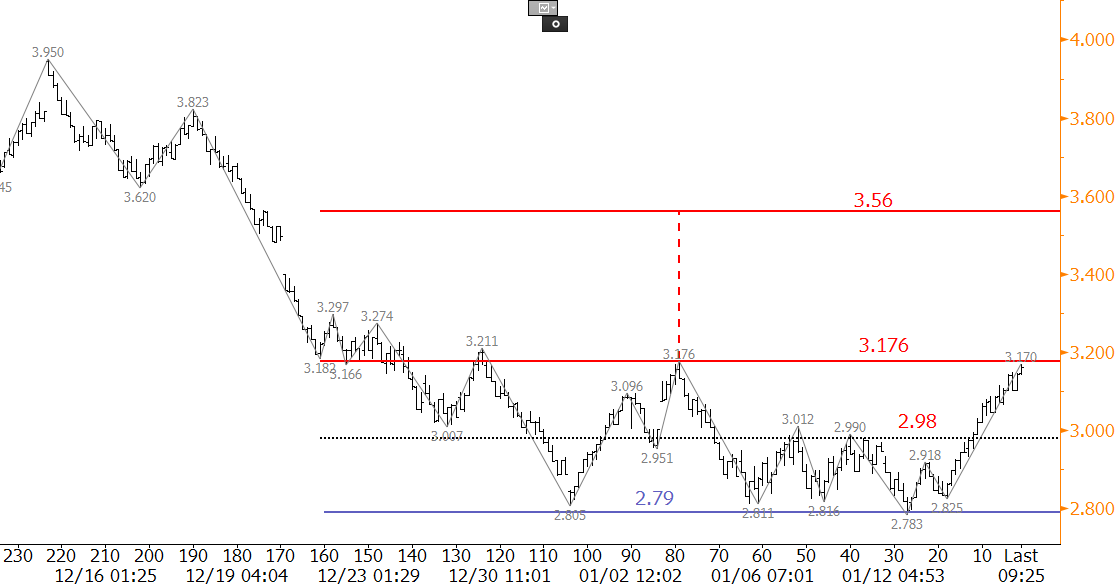
In addition, February overcame the crucial $3.176 swing high, and a sustained close over this would confirm the recent bottoming formation (arguably a triple or even quadruple bottom). The projection for this formation is $3.56.
Near-term support is $3.04 and then $2.94. These are the 38 percent and 62 percent retracements of the move up from $2.783 to $3.204 (swing high as of this analysis). These levels are also near the midpoint and open of today’s candlestick. A close back below $3.04 would call into question the validity of the move up. A close below $2.94 would negate the near-term positive tone altogether, and open the way for a continued decline.
The long-term outlook for natural gas is bearish, but the move up over the past two days has shifted the near-term outlook to positive. A close over the $3.176 swing high today will open the way for an extended correction to $3.38 and possibly higher tomorrow.
For more information about Kase’s weekly energy forecasts on natural gas and crude oil please visit our energy forecast page.
Dean Rogers
Senior Analyst
Kase and Company, Inc.