By Dean Rogers
Fears of a persistent supply glut still weigh heavily on the minds of traders. In addition, media reports stated that last week Saudi Arabia slashed prices on its highest-quality crude oil destined for Europe and Asia. Some are interpreting this as a signal that Saudi Arabia is still willing to deal with low prices, therefore, production cuts will not take place any time soon. A weaker U.S. dollar could support WTI, but the charts tend to indicate key support will be tested in coming days.
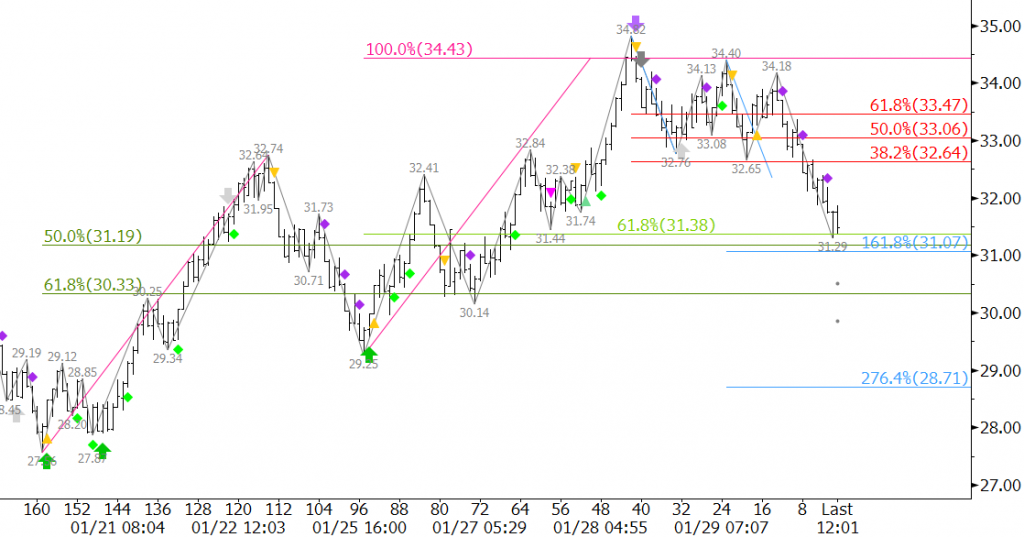
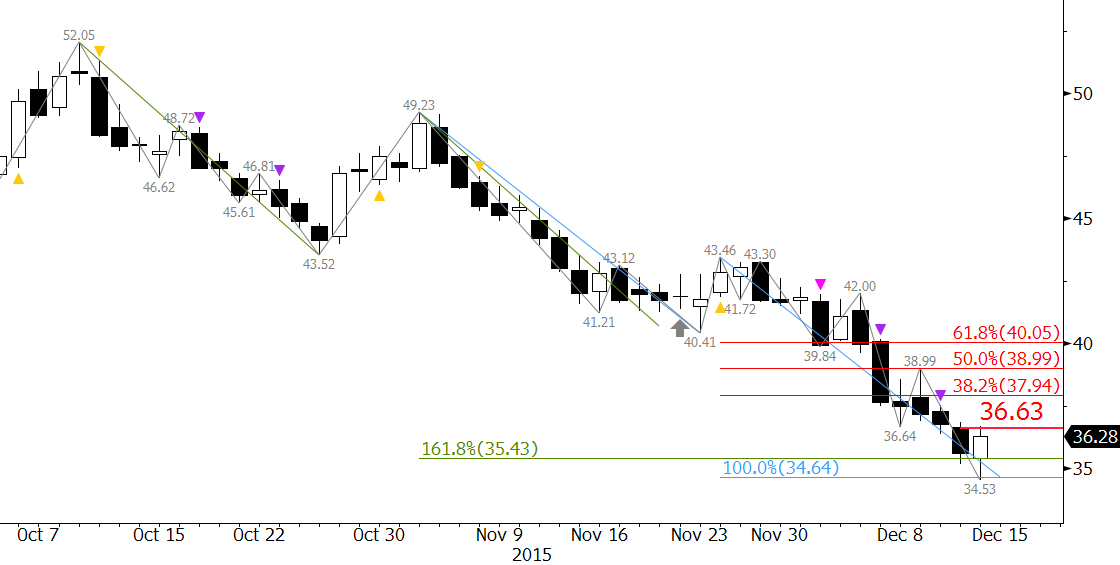
Last week’s brief rally on Wednesday was reportedly fueled by the declining dollar. However, the move stalled on Thursday and prompt month WTI futures have fallen to $29.57 so far. This is just above crucial support at $29.4, and the near-term outlook hinges on whether or not this objective holds.
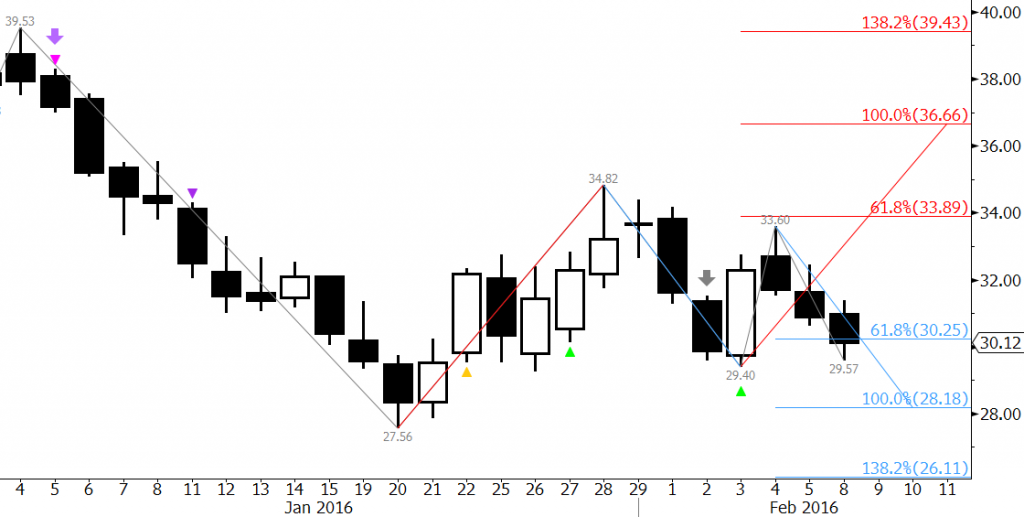
A move below $29.4 would take out the wave $27.56 – 34.82 – 29.4 and its potential to extend to $33.9 and higher. In addition, a close below $29.4 would call for at least $28.2, the last support level protecting the $27.56 contract low. Odds favor a decline to $28.2 because prices have already closed below the 0.618 projection of the wave down from $34.82.
That said, the move down will continue to be a grind. Resistance at $30.8 and $31.4 may be challenged before prices fall below $29.4 and extend to $28.2. We expect the latter to hold. A close over $31.4 would call for $32.8, which then connects to key resistance at $33.9.
This is a brief analysis and outlook for the next day or so. Our weekly Crude Oil Commentary is a much more detailed and thorough energy price forecast. If you are interested in learning more, please sign up for a complimentary four-week trial.