By Dean Rogers
Crude oil continued to rise on Monday as traders anticipate a production freeze that will be discussed by major producers at a meeting later this month. In addition, US production has started showing signs that it is declining. Caution is warranted because the prices rise has become asymptotic, but most technical factors are positive and call for higher prices over at least the next few days.
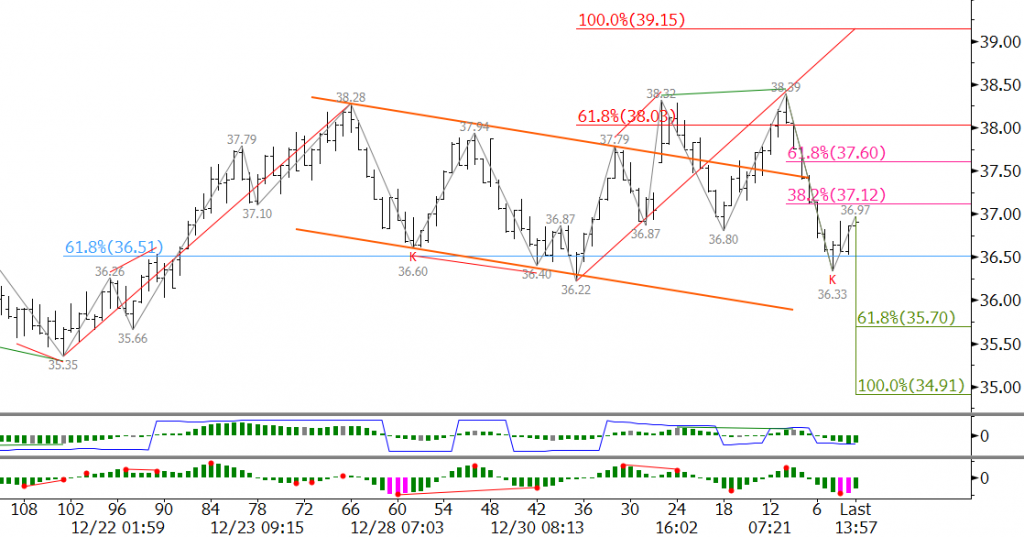
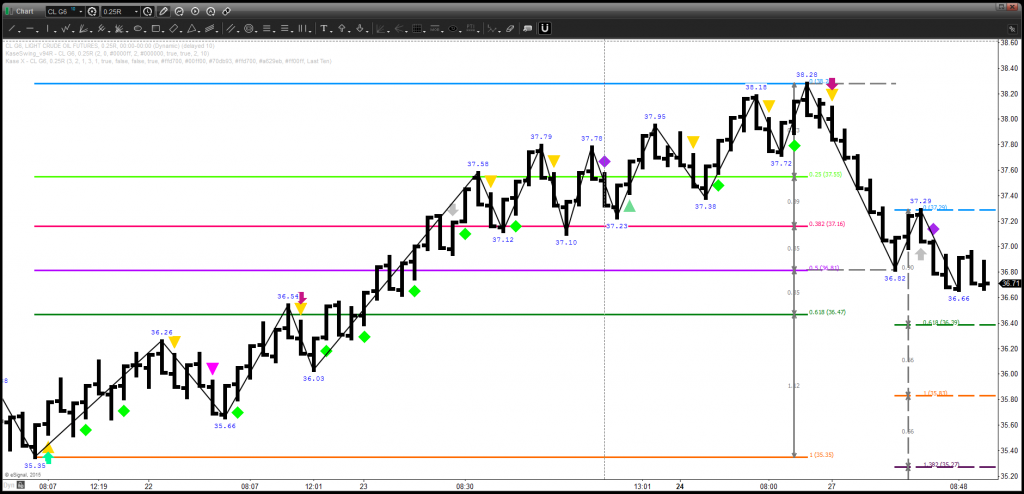
April WTI confirmed its $28.75 double bottom with the close over $36.28 on Monday. The double bottom’s target is $43.81. This is now a key objective for the relief rally. However, April must overcome a very important $39.2 target before it can make a serious run at $43.8. Most importantly, $39.2 is in line with the 1.618 projection of the wave $28.74 – 34.21 – 30.56. This is a confluent and crucial target because it protects the psychologically important $40.0 level.
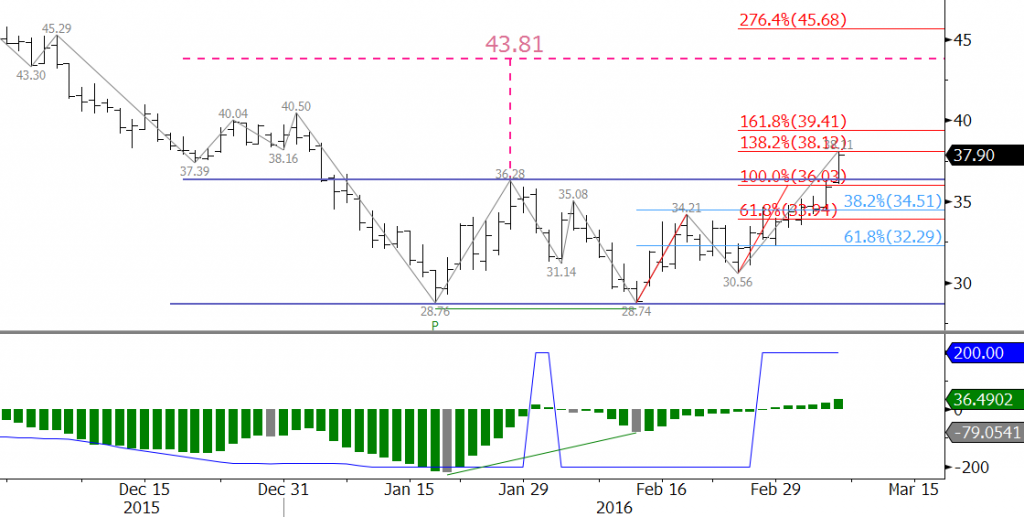
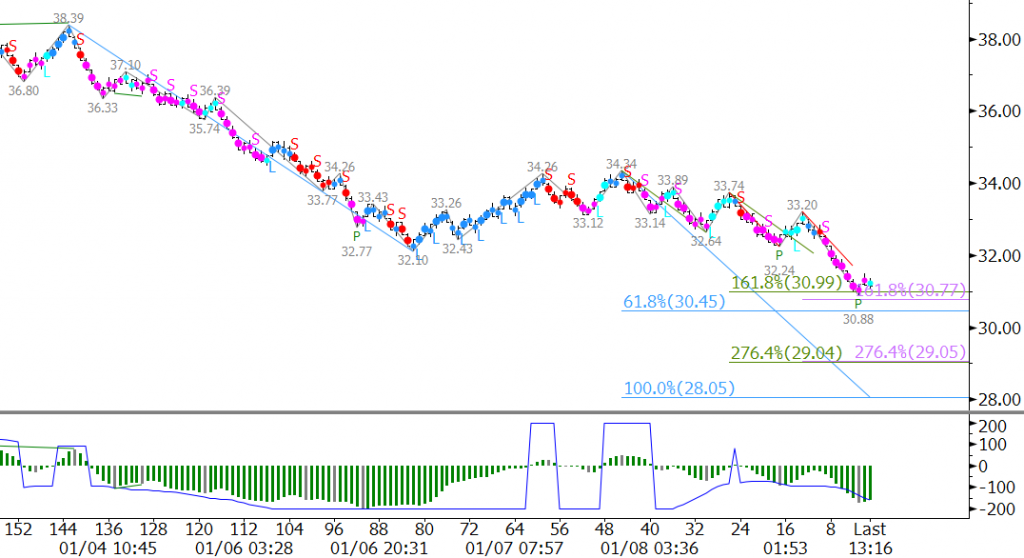
Tomorrow odds are 75 percent for $38.7 and 65 percent for $39.2. We expect to see a pullback once $39.2 is met. Without further help from underlying fundamentals, WTI may be hard pressed to overcome $39.2 over the next few days.
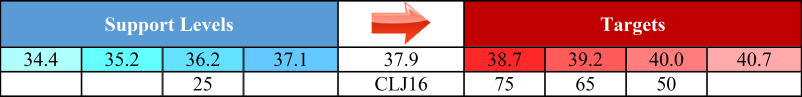
Look for support at $37.1 and $36.2. These are Monday’s midpoint and open. $36.2 should hold tomorrow. A close below this has 25 percent odds. This would indicate the move up may be in trouble and that a more significant correction to $35.2 and lower is underway.
This is a brief analysis and outlook for the next day or so. Our weekly Crude Oil Commentary is a much more detailed and thorough energy price forecast. If you are interested in learning more, please sign up for a complimentary four-week trial.