By Dean Rogers
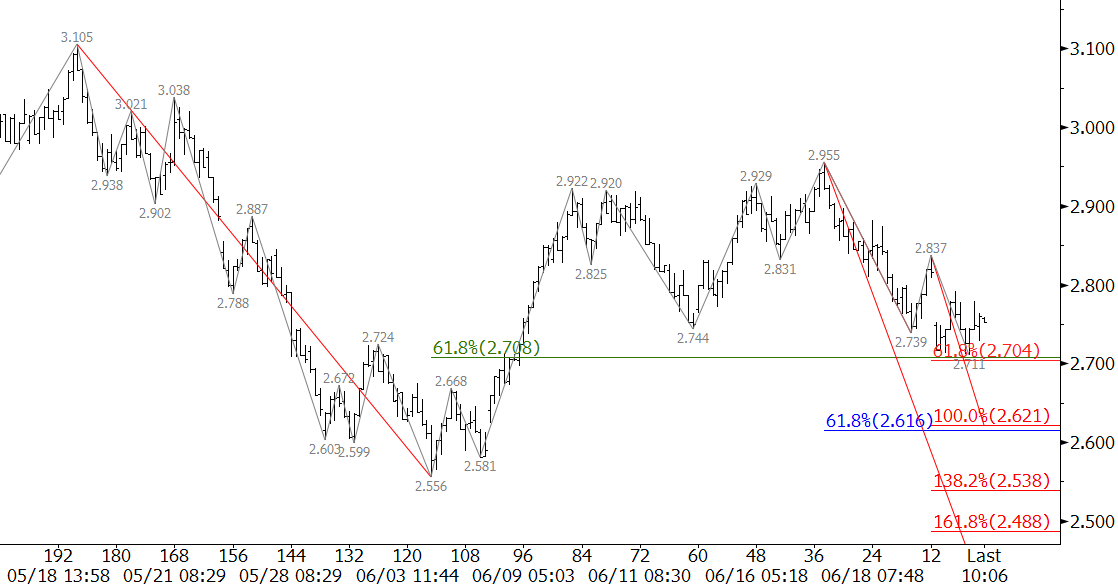
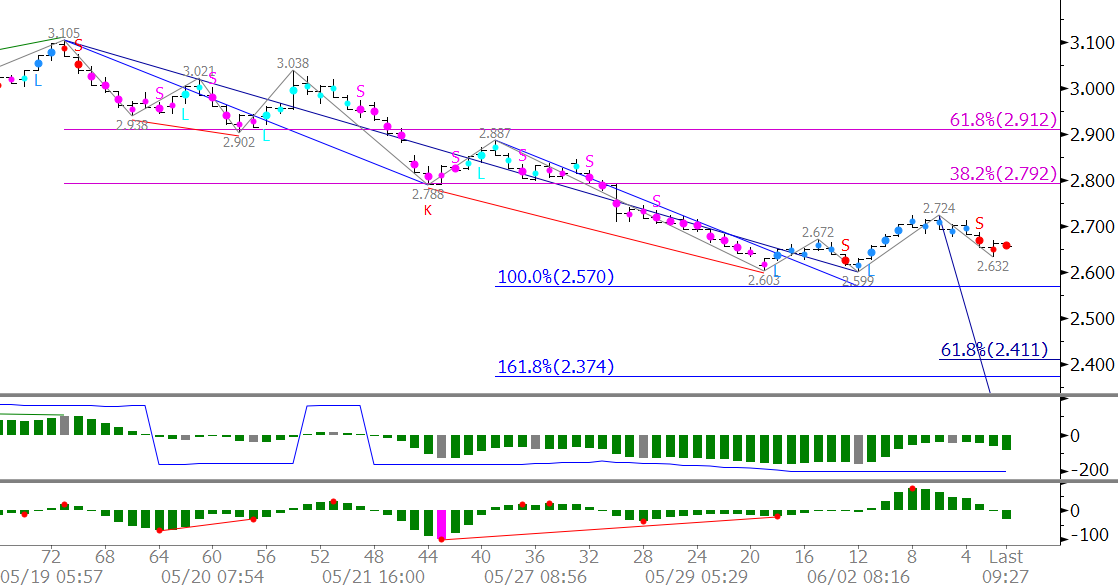
Natural gas continues to oscillate in a range between $2.65 and $2.95 as weather forecasts change from week-to-week. “Sweltering” heat in the US Northeast is the latest reason reported for this week’s price rise.
However, it is important to keep in mind that the shifting weather forecasts and related events have kept the market range bound for the last few months, and even if prices do break higher the move is still corrective of the longer-term down trend.
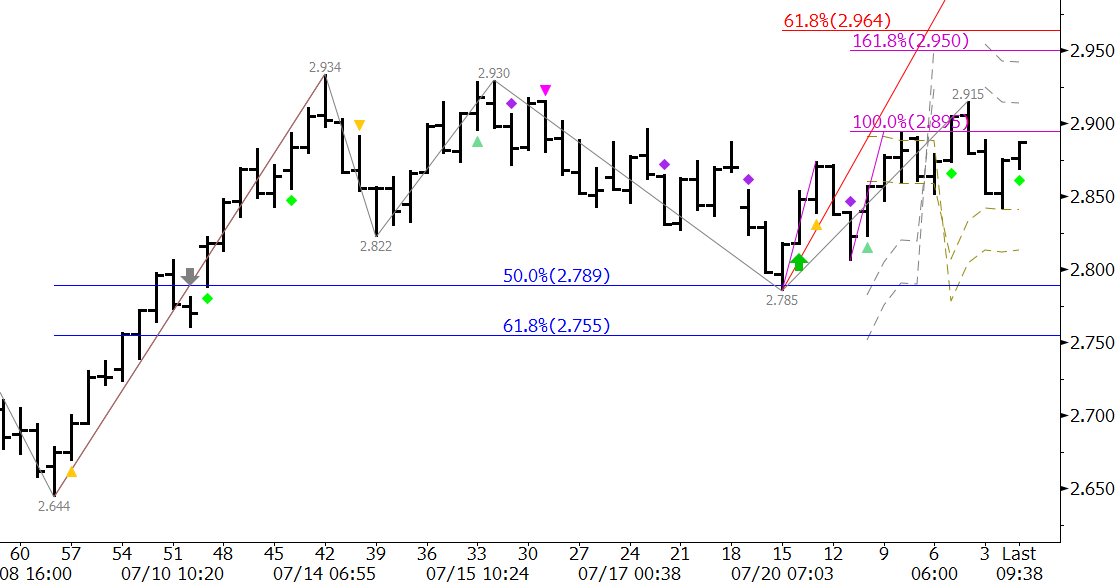
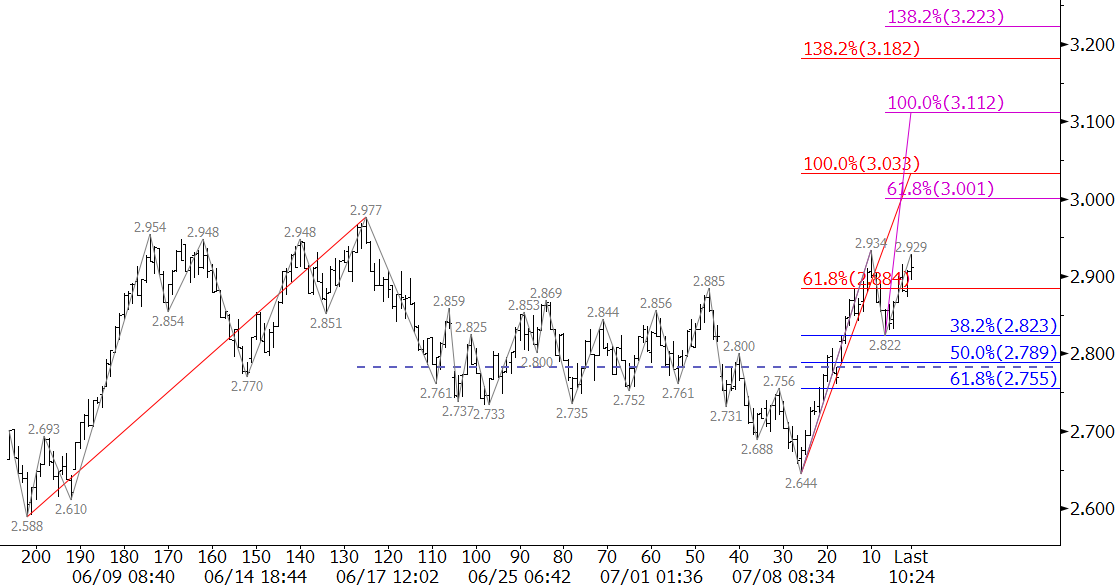
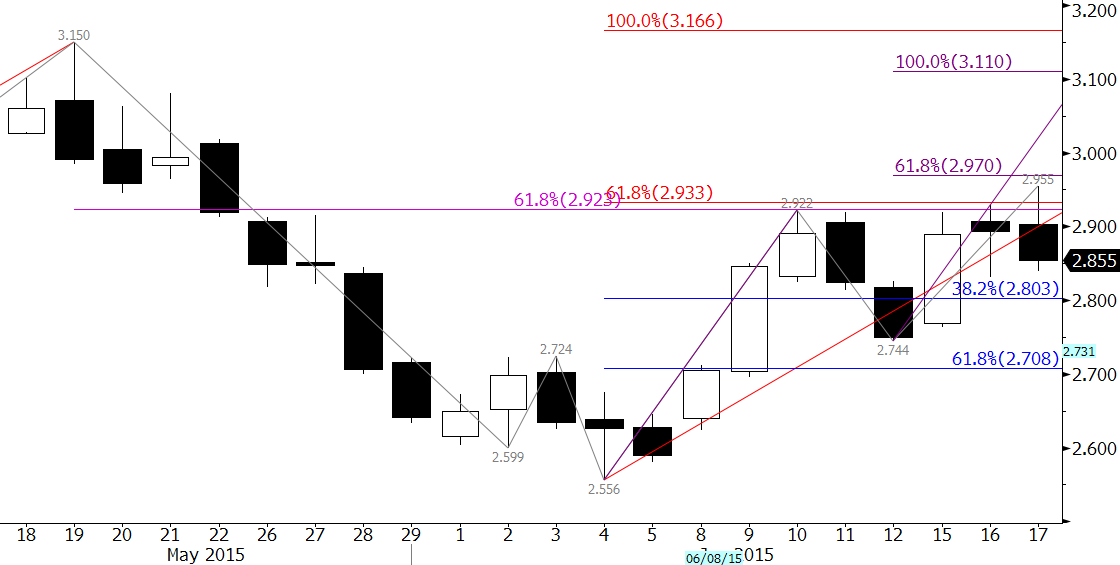
If I sound skeptical of the move up, it is because I am, but as of Wednesday’s close most technical factors indicate $2.95 may be challenged again. These factors show that the key to testing $2.95 is a close over $2.87. This crucial resistance level was tested a few times on Wednesday. It is the 62 percent retracement of the decline from $2.957 to $2.735, near last Thursday’s midpoint, and a confluent projection for the small waves up from $2.735. A close over $2.87 would call for a test of $2.95, which is in line with the 0.618 projection of the wave $2.656 – 2.957 – 2.735.
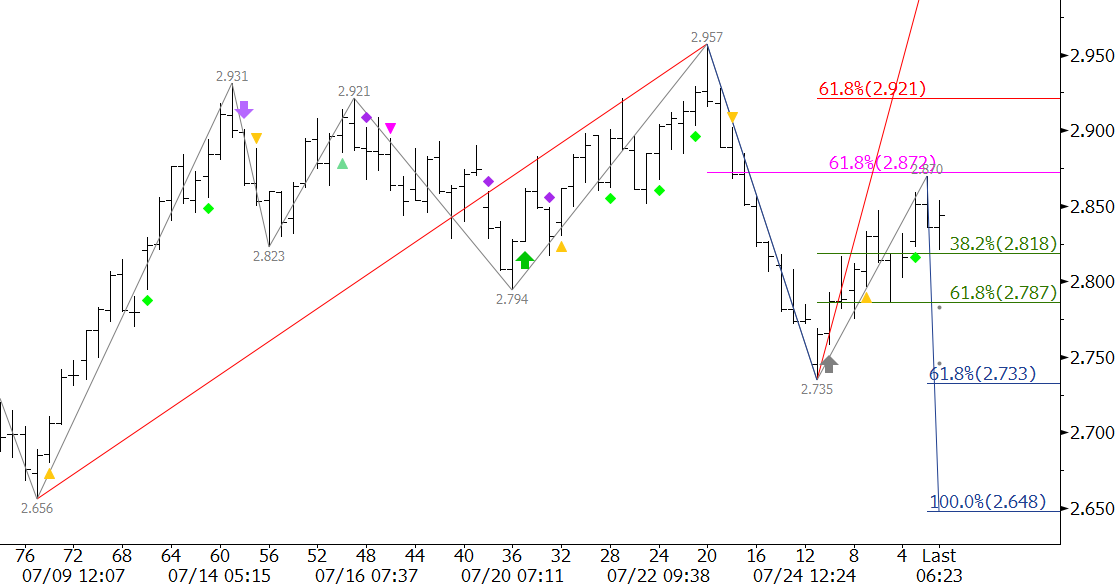
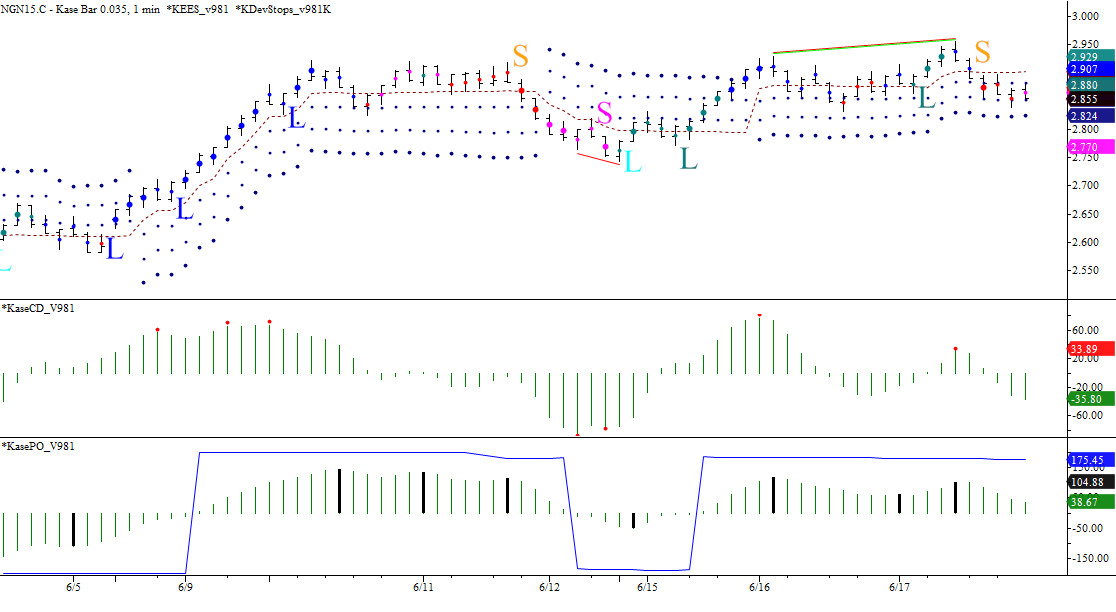
KaseX’s buy signal (green diamond) is promising and the pullback from $2.87 held the 38 percent retracement of the move up from $2.735. Look for prices to push above $2.87 in early trading tomorrow and to possibly overcome $2.95 in the event that the EIA storage report is bullish.
Near term support is $2.79, the 62 percent retracement from $2.735 to $2.87. This level should hold provided the move up is going to challenge $2.95. A close below $2.79 would shift the near-term outlook to negative and call for $2.73.
This is a brief natural gas forecast ahead of tomorrow’s EIA report. Our weekly Natural Gas Commentary is a much more detailed and thorough analysis. If you are interested in learning more, please sign up for a complimentary four week trial. We also offer trials of our KaseX trading indicator.