By Dean Rogers
Spot natural gas is still looking a bit unsure of the move up, but the forward months, especially the winter strip, are looking reasonably positive. This likely indicates that a longer-term move up is underway, but for now it is looking like the prompt month could settle into a choppy trading range while it awaits more data (weather) to push natural gas prices higher or lower.
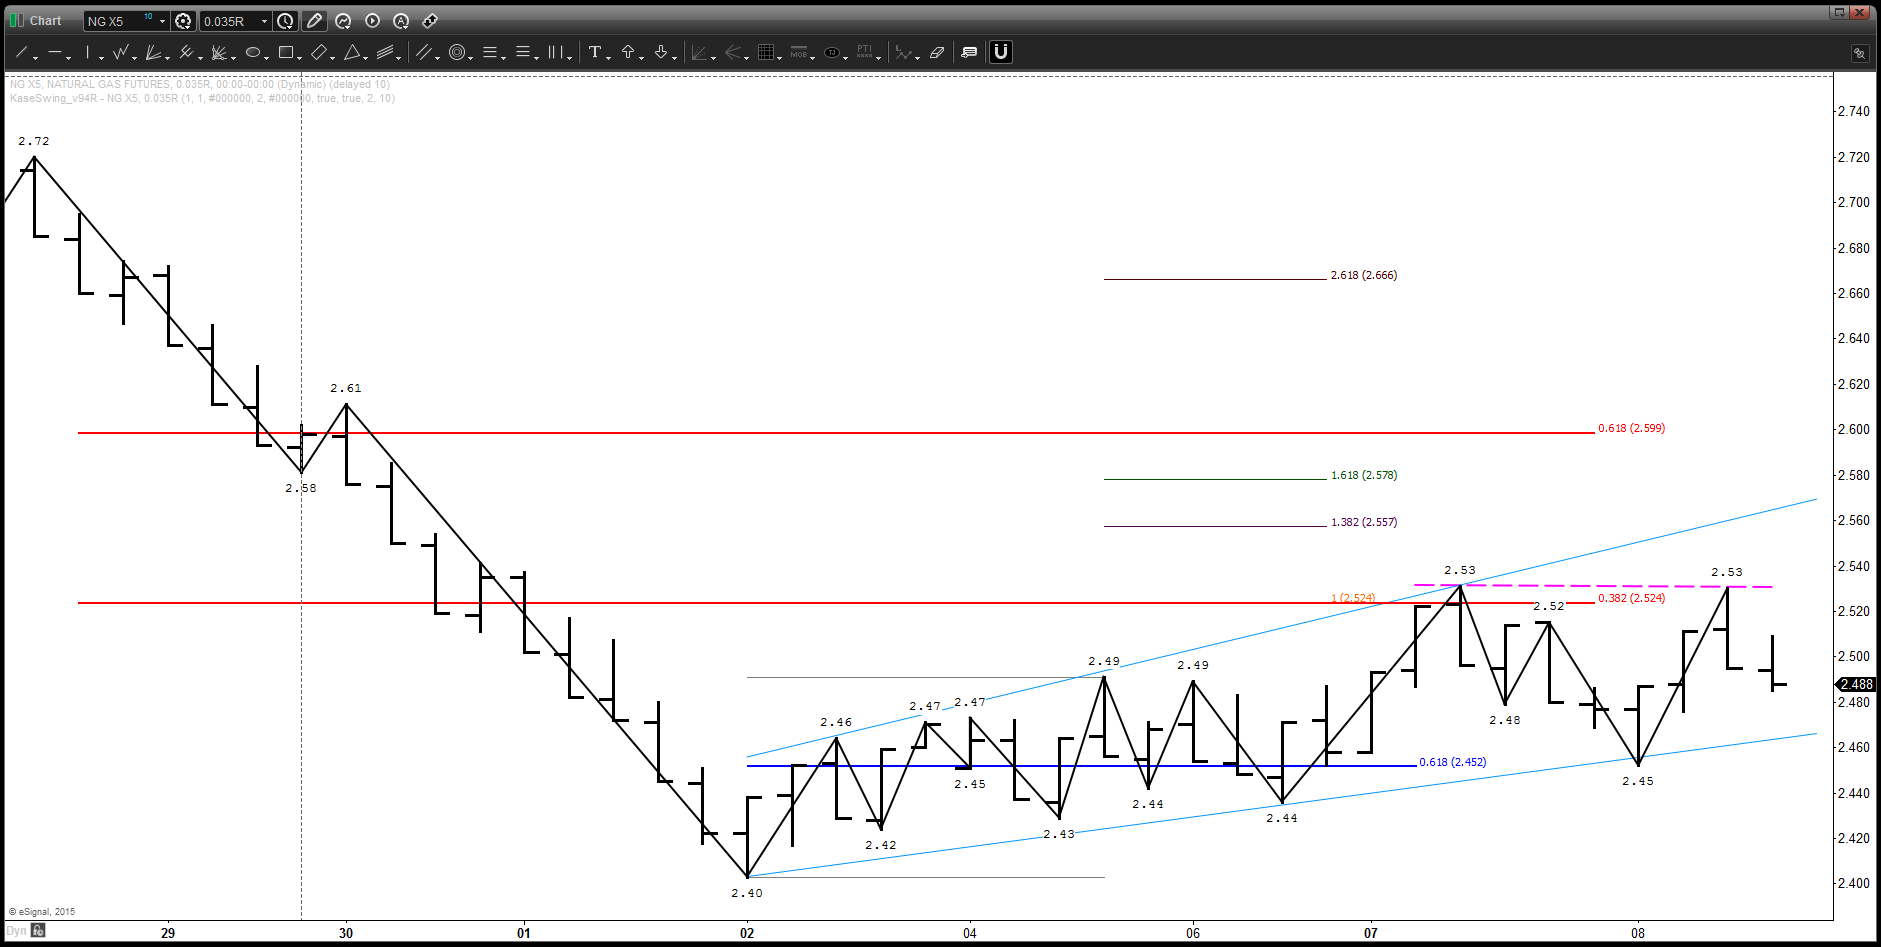
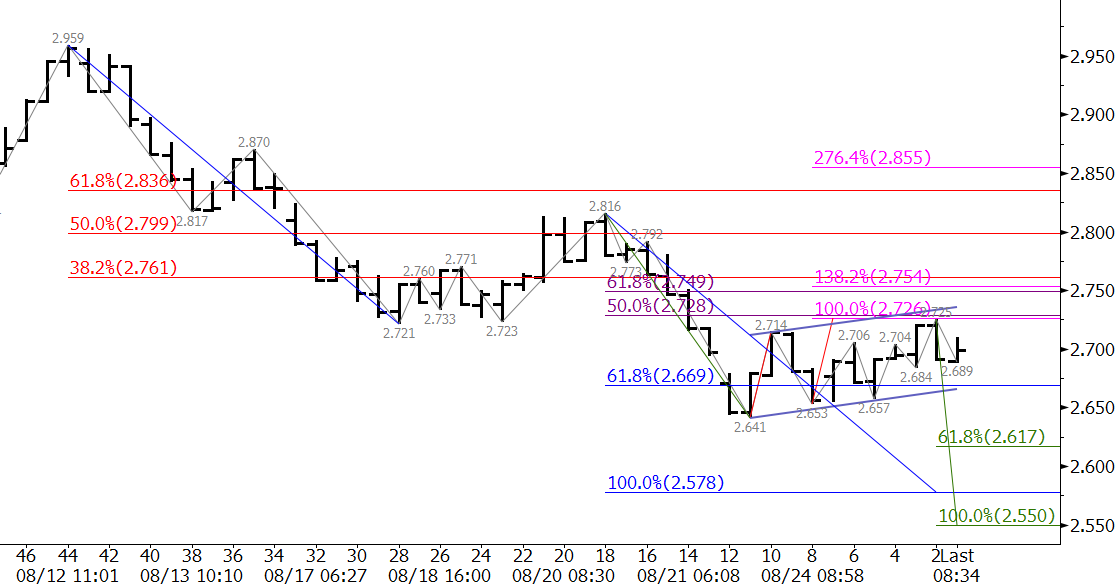
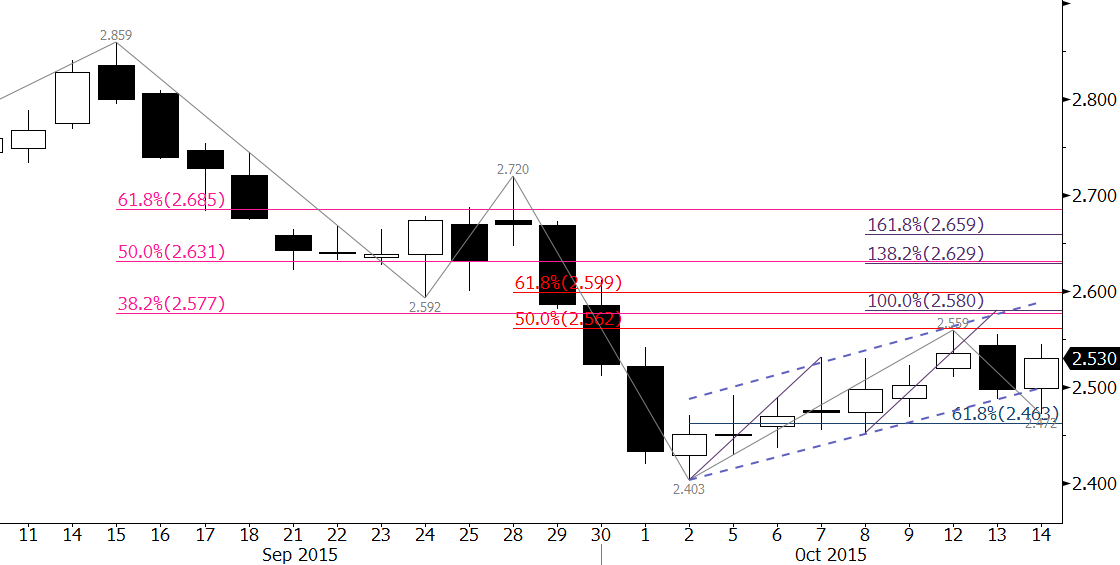
November futures stalled at $2.559 before reaching crucial resistance at $2.57. Tuesday’s bearish engulfing line was followed by a positive move on Wednesday. Resistance at $2.57 should be tested. A close over $2.57 would call for $2.63 which then connects to $2.68. First support is $2.49, but the key level for the near-term is near $2.43. A close below this would confirm the move up has failed and would open way for a new low.
This is a brief natural gas forecast ahead of tomorrow’s EIA report. Our weekly Natural Gas Commentary is a much more detailed and thorough analysis. If you are interested in learning more, please sign up for a complimentary four week trial.