Natural Gas Technical Analysis and Near-Term Outlook
This is a brief analysis for the next day or so. Our weekly Natural Gas Commentary and daily updates are much more detailed and thorough energy price forecasts that cover key natural gas futures contracts, calendar spreads, the UNG ETF, and several electricity contracts. If you are interested in learning more, please sign up for a complimentary four-week trial.
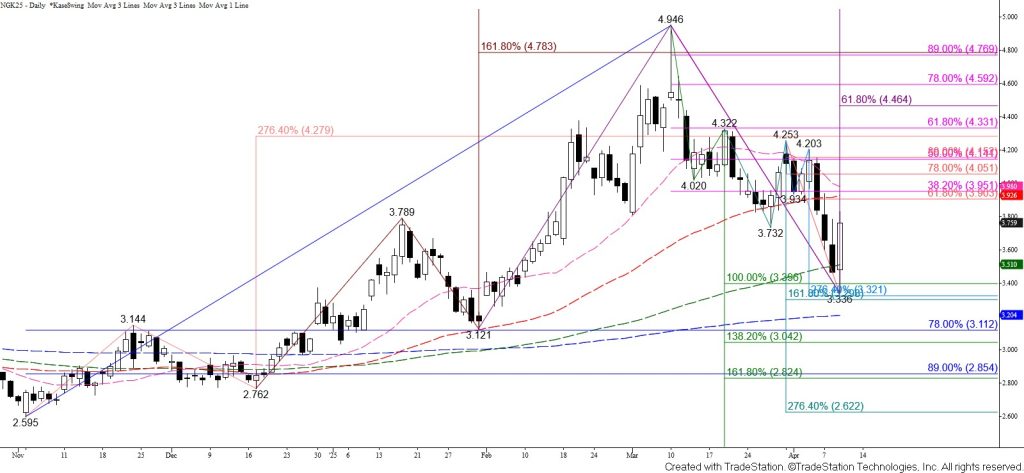
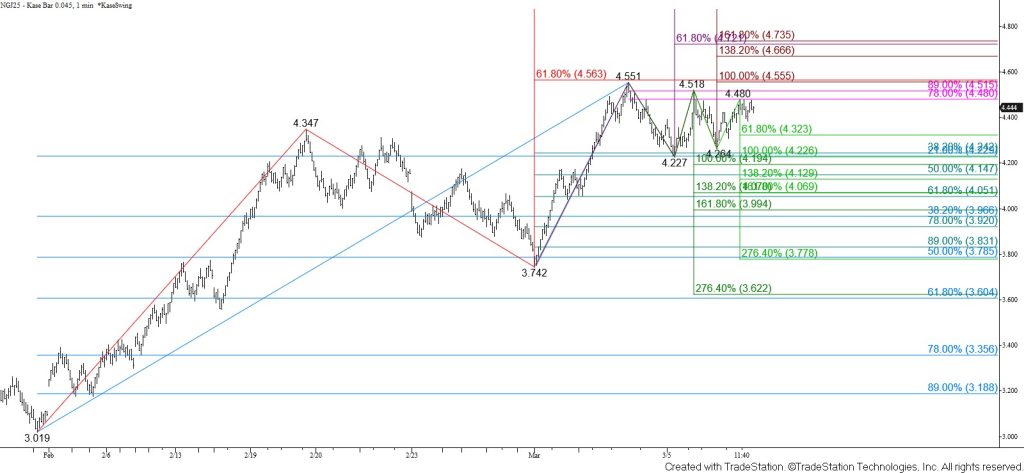
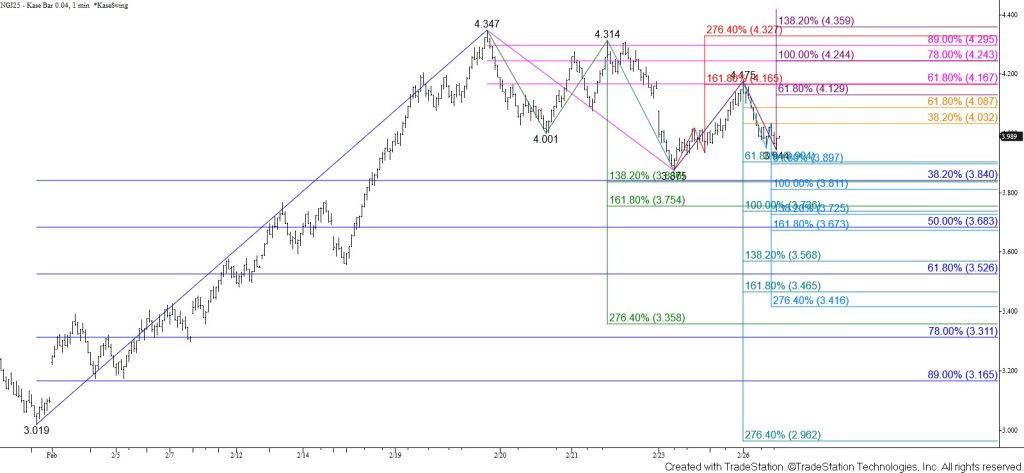
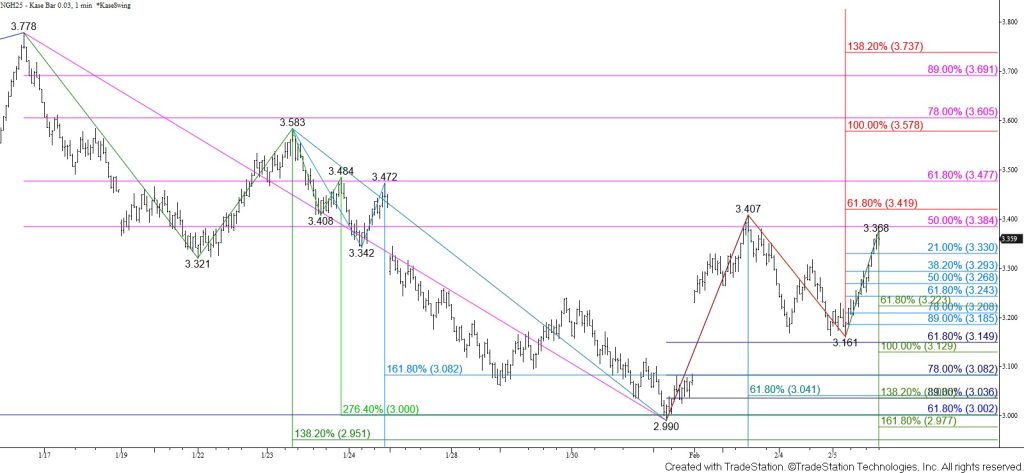
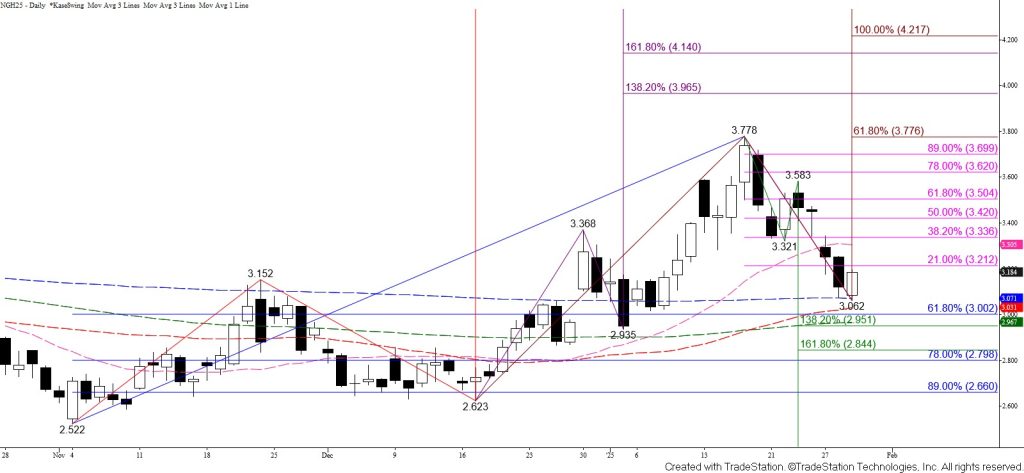
May natural gas initially fell below the crucial $3.40 equal to (1.00) target of the primary wave down from $4.946. The move down stalled at $3.336, which was just above the $3.31 larger than (1.618) target of the wave down from $4.322 and the XC (2.764) projection of the wave down from $4.253. The subsequent move up recaptured the 100-day moving average, settled above Tuesday’s open, and confirmed daily bullish MACD and Stochastic divergences. Therefore, a bullish reversal might be underway.
The intra-day wave formation up from $3.336 calls for a test of $3.89. This is the highest that the first wave up from $3.336 projects and is in line with the 62 percent retracement of the decline from $4.253. Overcoming this will call for the 38 percent retracement of the decline from $4.946 at $3.95 to be tested. Settling above $3.95 will imply that the move up is more than just a simple correction, clearing the way for $4.05 and possibly $4.15 to be challenged in the coming days.
Nevertheless, Monday’s open held on a closing basis and the wave formation up from $3.336 is due for a correction before overcoming $3.89. Should prices turn lower early tomorrow look for initial support at $3.64 and then $3.52. The $3.52 level is expected to hold. Falling below this would call for another attempt to settle below key support at $3.40.