Gold Price Forecast – November 7, 2024

Gold Technical Analysis and Near-Term Outlook

This is a brief analysis for the next day or so. Our weekly Metals Commentary and daily updates are much more detailed and thorough energy price forecasts that cover key COMEX precious metals futures contracts and LME Non-Ferrous (Base) metals, spot gold, the gold/silver ratio, and gold ETFs. If you are interested in learning more, please sign up for a complimentary four-week trial.

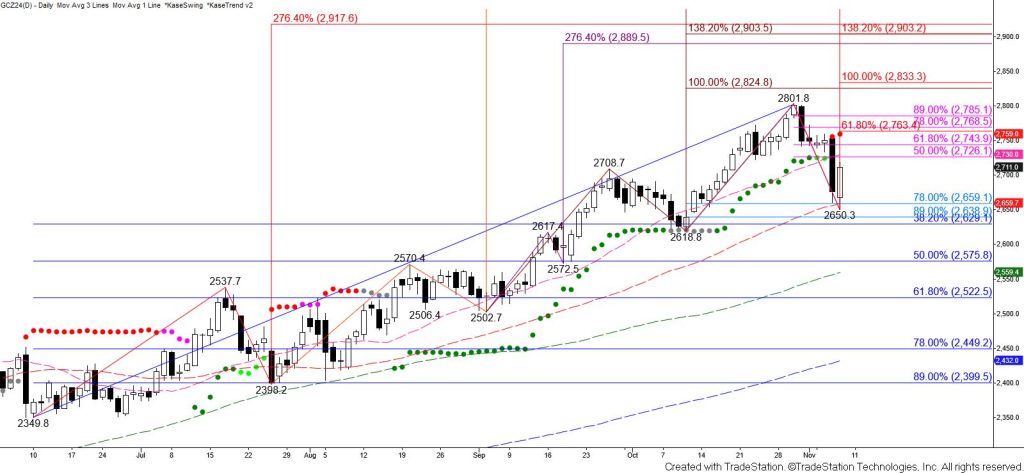
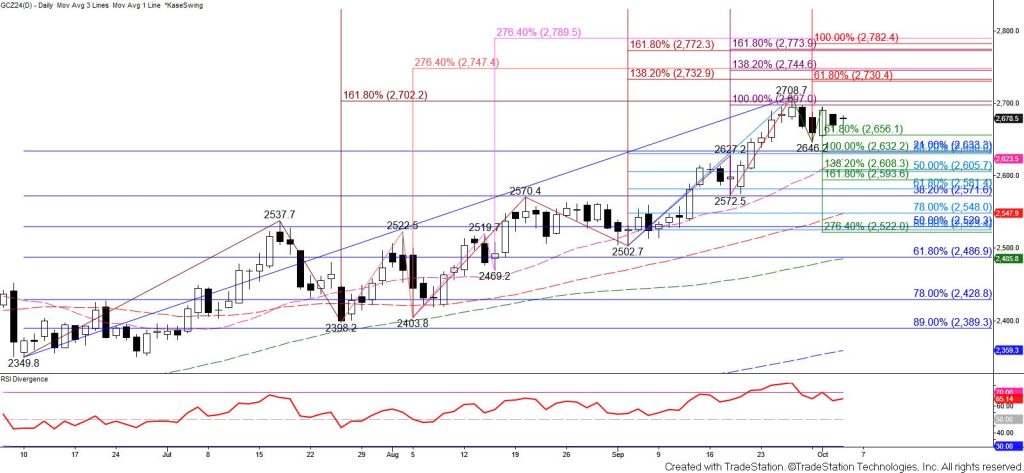
Gold rose after Wednesday’s significant decline. The 78 percent retracement of the rise from $2618.8 and the 50-day moving average were tested early but the move down stalled at $2650.3 before rising to challenge Wednesday’s $2715 midpoint. This level held and prices settled below the 20-day moving average again.

Today’s rise dampens the likelihood of a deeper test of support in the coming days. Even so, the daily Kase Trend indicator is bearish and weekly bearish KaseCD and MACD divergences will likely be confirmed unless gold can overcome the $2801.8 on Friday. Therefore, the near-term outlook continues to lean bearish, and taking out $2672 will call for a test of $2652. Settling below $2652 will call for a key objective at $2626 to be challenged. The $2626 objective is the smaller than (0.618) target of the new primary wave down from $2801.8, the 38 percent retracement of the rise from $2349.8, and the last target protecting the last major swing low of $2618.8. Settling below $2626 will indicate that a major test of support is finally underway.

Nevertheless, there is a good chance for a test of the 20-day moving average at $2730 early Friday. Overcoming this will call for the 62 percent retracement of the decline from $2801.8 at $2744 and possibly a test of key near-term resistance at $2763. The $2763 level is the smaller than target of the wave up from $2618.8. Settling above this will imply that the corrective move down is complete and shift the odds in favor of gold rising to new highs next week.

Gold Technical Analysis and Near-Term Outlook

This is a brief analysis for the next day or so. Our weekly Metals Commentary and daily updates are much more detailed and thorough energy price forecasts that cover key COMEX precious metals futures contracts and LME Non-Ferrous (Base) metals, spot gold, the gold/silver ratio, and gold ETFs. If you are interested in learning more, please sign up for a complimentary four-week trial.

Gold’s move up has been due for a solid test of support for some time now. Weekly momentum has been overbought and daily momentum moved back into overbought territory on the RSI earlier in the week. The bullish trend is intact, but today’s decline and confirmation of bearish daily MACD and RSI divergences suggest that a correction might finally be underway.

The challenge is that a similar pattern that formed on October 23 failed to lead to a meaningful correction.

Regardless, today’s move down was bearish for the near-term outlook, and a test of the 38 percent retracement of the rise from $2349.8 at $2732 is expected. Closing below this will call for the 50 percent retracement from $2618.8 and the 21 percent retracement of the rise from $2349.8 at $2710 to be challenged. This is the most important target because closing below $2710 will take out the 20-day moving average and shift the Kase Trend indicator to bearish (which it has not been since August 16).

That said, prices rose a bit late this afternoon. Should gold overcome today’s $2774 midpoint look for another test of key resistance at $2802. Settling above $2802 will negate the bearish patterns and signals that formed today and put the near-term odds back in favor of gold rising to $2823 and higher.

Gold Technical Analysis and Near-Term Outlook

This is a brief analysis for the next day or so. Our weekly Metals Commentary and daily updates are much more detailed and thorough energy price forecasts that cover key COMEX precious metals futures contracts and LME Non-Ferrous (Base) metals, spot gold, the gold/silver ratio, and gold ETFs. If you are interested in learning more, please sign up for a complimentary four-week trial.

December gold rose above the $2708.7 high and finally settled above the $2702 larger than (1.618) target of the wave up from $2349.8. The move up is now poised to challenge the $2720 equal to (1.00) target of the wave up from $2618.8 tomorrow. Settling above $2720 will call for confluent wave projections at $2732, $2746, and $2760 to be challenged in the coming days.

There are no bearish patterns or confirmed signals that call for the move up to stall before reaching at least $2720 and likely $2732. Even so, now that prices have risen to a new high there is potential for daily bearish divergences on the KasePO, KaseCD, RSI, and Stochastic momentum oscillators. However, to confirm any of these divergence signals both price and momentum must form swing highs before momentum rises to a new high too.

Should gold turn lower without warning look for initial support at $2690. Falling below this will call for a test of the 38 percent retracement of the rise from $2618.8 at $2677. This level is expected to hold. Key support for the outlook in the coming days is the 62 percent retracement at $2655. Settling below this will call for gold to take out the $2654.4 swing low, thus invalidating the recent wave up from $2618.8 that projects to $2720 and higher.

Gold Technical Analysis and Near-Term Outlook

This is a brief analysis for the next day or so. Our weekly Metals Commentary and daily updates are much more detailed and thorough energy price forecasts that cover key COMEX precious metals futures contracts and LME Non-Ferrous (Base) metals, spot gold, the gold/silver ratio, and gold ETFs. If you are interested in learning more, please sign up for a complimentary four-week trial.

Gold rose to challenge the 20-day moving average after settling below a confluent and important target at $2632 on Wednesday. The wave down from $2708.7 still favors a test of its $2607 intermediate (1.382) target and possibly the $2594 larger than (1.618) target in the coming days. Taking out $2630 tomorrow will clear the way for a test of at least $2607.

Nevertheless, today’s bullish piercing pattern warns that the corrective move down might be complete. Given this afternoon’s post-settlement rise, there is also a good chance for a test of the 38 percent retracement of the decline from $2708.7 at $2653 first. A normal correction will hold $2563. Overcoming this would call for a test of key resistance and the 62 percent retracement at $2674. Settling above $2674 would imply that the corrective move down is complete and put the near-term odds in favor of testing $2700 again.

Gold Technical Analysis and Near-Term Outlook

This is a brief analysis for the next day or so. Our weekly Metals Commentary and daily updates are much more detailed and thorough energy price forecasts that cover key COMEX precious metals futures contracts and LME Non-Ferrous (Base) metals, spot gold, the gold/silver ratio, and gold ETFs. If you are interested in learning more, please sign up for a complimentary four-week trial.

December gold’s pullback from $2708.7 confirmed a daily RSI overbought signal. However, the pullback stalled before testing the $2656 smaller than (0.618) target of the wave down from $2708.7 today. This is a tight call for the near term, but odds lean in favor of testing the $2702 larger than (1.618) target of the wave up from $2349.8 again. Settling above this will call for $2720 and likely $2732.

Nevertheless, the uptrend is due for a more significant correction based on the RSI overbought signal. However, unless gold takes out $2656 and settles below the $2632 equal to (1.00) target of the wave down from $2708.7 the move down from $2708.7 will likely be another short-lived correction. Closing below $2632 will put the near-term odds in favor of a more substantial test of support with thresholds at $2607 and $2594.

Gold Technical Analysis and Near-Term Outlook

This is a brief analysis for the next day or so. Our weekly Metals Commentary and daily updates are much more detailed and thorough energy price forecasts that cover key COMEX precious metals futures contracts and LME Non-Ferrous (Base) metals, spot gold, the gold/silver ratio, and gold ETFs. If you are interested in learning more, please sign up for a complimentary four-week trial.

December gold finally broke higher out of a bullish wedge after forming a shortfall within the pattern last Friday. Gold also settled above an important area of resistance between $2565 and $2570. The $2586 equal to (1.00) target of the wave up from $2349.8 was also tested and held on a closing basis. Even so, today’s break higher out of the wedge was bullish for the outlook in the coming days and weeks.

The move up is now poised to reach another confluent objective at $2605. This is the most confluent target on the chart and might prove to be a temporary stalling point. Closing above $2605 will clear the way for a push to $2630 and higher.

Should a throwback occur after testing and holding $2586 look for the upper trend line of the wedge at $2554 to hold. A throwback to test the breakout point of a bullish pattern is somewhat common. Taking out $2554 would warn of a false breakout. Settling below $2535 would confirm this is the case and put the near-term odds in favor of testing $2521 and $2497 in the coming days.

Gold Technical Analysis and Near-Term Outlook

This is a brief analysis for the next day or so. Our weekly Metals Commentary and daily updates are much more detailed and thorough energy price forecasts that cover key COMEX precious metals futures contracts and LME Non-Ferrous (Base) metals, spot gold, the gold/silver ratio, and gold ETFs. If you are interested in learning more, please sign up for a complimentary four-week trial.

December gold’s lackluster follow-through after Wednesday’s decline was bullish for the near-term outlook. Gold is poised to challenge a highly confluent and key target at $2570 again. Settling above $2570 will open the way for the $2586 equal to (1.00) target of the wave up from $2349.8 to finally be fulfilled.

That said, the $2570 target has been resilient in recent weeks and each time gold has approached this objective prices have pulled back. The potential for a second straight weekly bearish doji also warns that the move up may be exhausted. Should gold turn lower and take out the $2525 smaller than (0.618) target of the wave down from $2570.4 look for a test of key near-term support at $2500.

Gold Technical Analysis and Near-Term Outlook

This is a brief analysis for the next day or so. Our weekly Metals Commentary and daily updates are much more detailed and thorough energy price forecasts that cover key COMEX precious metals futures contracts and LME Non-Ferrous (Base) metals, spot gold, the gold/silver ratio, and gold ETFs. If you are interested in learning more, please sign up for a complimentary four-week trial.

Gold pulled back after testing and holding major resistance at $2570. The pullback is likely a correction and held the $2515 equal to (1.00) target of the wave down from $2570.4 on a closing basis today. The $2515 level is also in line with the completion point of daily bearish hanging man and shooting star patterns that formed Monday, Tuesday, and Wednesday.

Nevertheless, today’s decline confirmed bearish daily RSI, Stochastic, and MACD divergences and a daily KasePO PeakOut (overbought) signal. Therefore, the near-term outlook is bearish for gold and a test of $2499 and likely $2487 will take place within the next day or so. For the move up to retain a reasonable chance at extending again in the coming days $2487 must hold. Closing below $2487 will take out the larger than (1.618) target of the wave down from $2570.4, the 38 percent retracement of the rise from $2349.8, and confirm the daily bearish candlestick patterns.

Should gold rally and overcome $2538 look for a test of the $2557.3 corrective swing high of the wave down from $2570.4. Overcoming $2557 will invalidate this wave and negate the projections to $2499 and lower. Such a move would also call for another test and attempt to close above the $2570 threshold.

Gold Technical Analysis and Near-Term Outlook

This is a brief analysis for the next day or so. Our weekly Metals Commentary and daily updates are much more detailed and thorough energy price forecasts that cover key COMEX precious metals futures contracts and LME Non-Ferrous (Base) metals, spot gold, the gold/silver ratio, and gold ETFs. If you are interested in learning more, please sign up for a complimentary four-week trial.

December gold has been trading in a range between approximately $2400 and $2430 since mid-July. Prices are trading near the top of the range and a break higher out of the range is ultimately expected.

Gold will need to close above key resistance at $2530 to confirm that a break higher is finally underway. Such a move will open the way for $2560 and $2581. Overcoming the $2514 smaller than (0.618) target of the wave up from $2349.8 will clear the way for a test of $2530 within the next few days.

The pullback from $2519.7 looks like a correction based on today’s trading. However, the move down took out the smaller than (0.618) target of the wave down from $2519.7 and should test the $2464 equal to (1.00) target first. The move up from $2469.2 also held the 62 percent retracement of the decline from $2519.7 at $2500.

Closing below $2464 now looks as though it will be a challenge but would call for a test of key near-term support at $2447. This is the intermediate (1.382) target of the wave down from $2519.7, the smaller than target of the wave down from $2522.5, and the 62 percent retracement of the rise from $2403.8. Settling below this would put the near-term odds in favor of gold falling to test the $2401 equal to (1.00) target of the wave down from $2522.5.

Gold Technical Analysis and Near-Term Outlook

This is a brief analysis for the next day or so. Our weekly Metals Commentary and daily updates are much more detailed and thorough energy price forecasts that cover key COMEX precious metals futures contracts and LME Non-Ferrous (Base) metals, spot gold, the gold/silver ratio, and gold ETFs. If you are interested in learning more, please sign up for a complimentary four-week trial.

December gold rose to challenge resistance at $2465 today. This level is in line with the equal to (1.00) target of the wave up from $2403.8 and the 50 percent retracement from $2522.5. The move up could still prove to be a correction given the wave down from $2537.7 favors a test of its $2386 equal to target. However, today’s move up confirmed Wednesday’s morning star. Therefore, tomorrow’s outlook is bullish.

The next major objective is $2477. This target is split between the 62 percent retracement from $2537.7 and the smaller than (0.618) target of the wave up from $2398.2. Settling above $2477 would suggest that the move down is complete and open the way for another test of the $2514 smaller than target of the wave up from $2349.8 and then the $2528 equal to target of the wave up from $2398.2.

Should the $2465 level continue to hold look for initial support at $2442. Falling below this would call for a test of $2428 and possibly key near-term support at $2405. Closing below $2405 would shift the near-term odds back in favor of fulfilling the $2386 equal to target of the wave down from $2537.7.