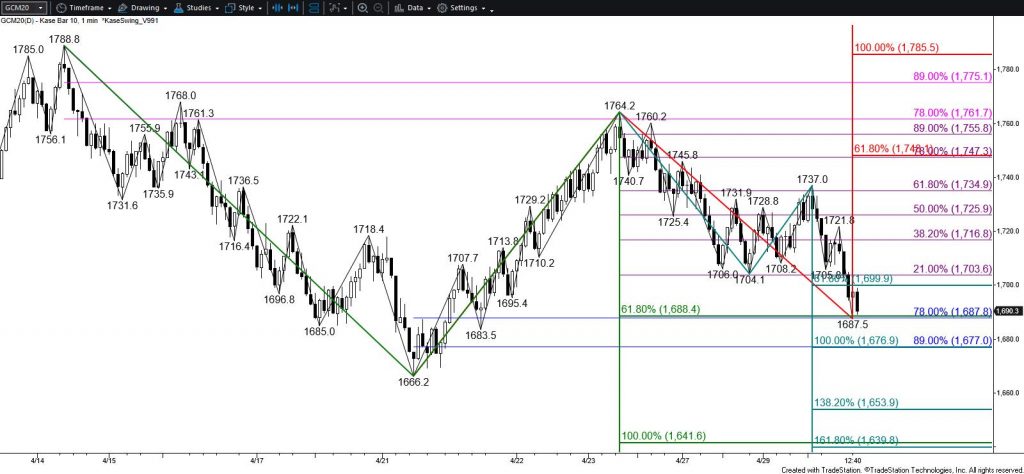
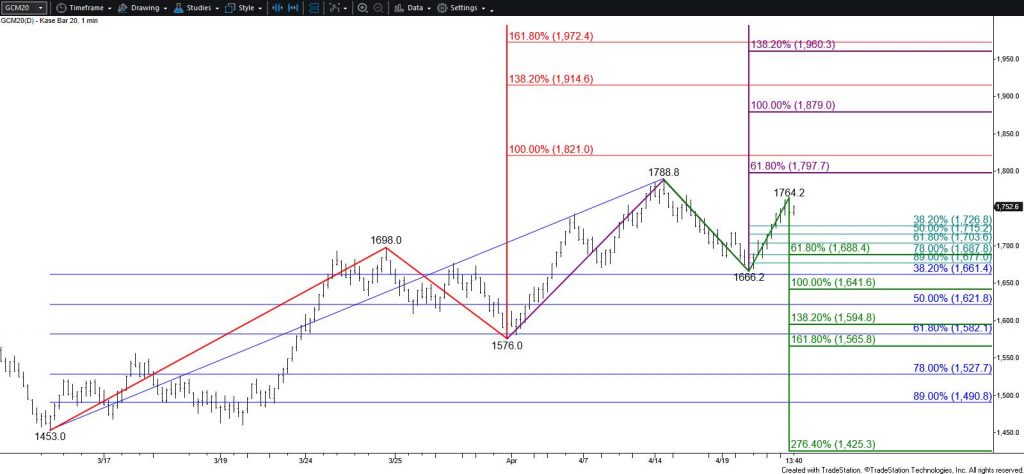
Gold’s formation of a bullish engulfing line today strongly suggests that the primary wave down from $1788.8 may fail to meet its $1642 equal to (1.00) target as previously expected. Instead, prices are poised to rise and challenge at least $1752, which then connects to $1764. Overcoming $1764 would call for a move above the $1764.2 swing high. This would invalidate the wave down from $1788.8 and clear the way for $1797 and higher.
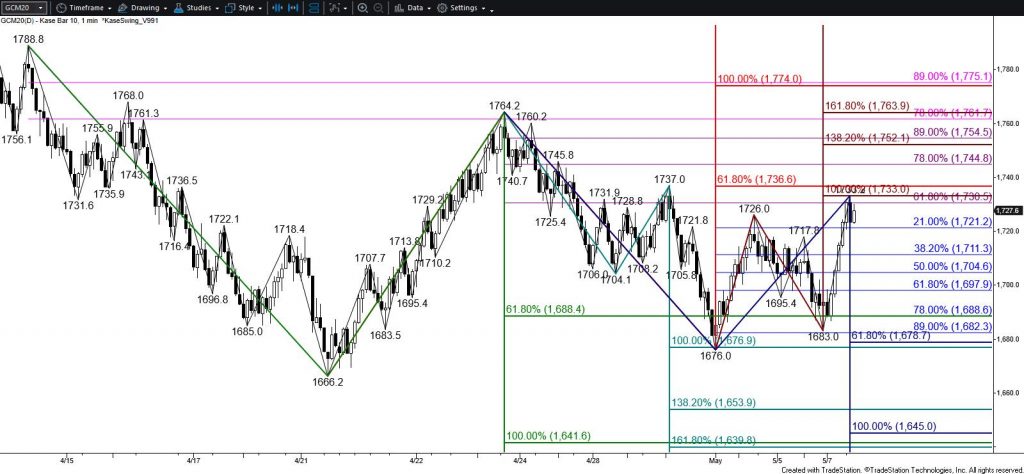
Nevertheless, the 62 percent retracement of the move down from $1764.2 held today, and the move up from $1683.0 lacks a definitive wave restructure. Therefore, a test of $1710 support might take place first. This level is expected to hold. Key support for the near-term is $1697. Settling below $1697 would shift near-term odds back in favor of a move toward $1642.
This is a brief analysis for the next day or so. Our weekly Metals Commentary and daily updates are much more detailed and thorough energy price forecasts that cover key COMEX precious metals futures contracts and LME Non-Ferrous (Base) metals, spot gold, the gold/silver ration, and gold ETFs. If you are interested in learning more, please sign up for a complimentary four-week trial.