Big Hotel Stocks – Starwood Is Not Hot

By Big Hotel ImageCynthia Kase

Read on TraderPlanet.com

The big hotel chains recovered from the financial crisis well and until recent months showed steady gains. Diversification, appealing to differing guests, as well as shifting property ownership to partners helped heat the sector. But now, it looks like supply is catching up with demand, and now the sector is cooling off. To evaluate specifics, I’ve chosen to look at Starwood Hotels & Resorts Worldwide Inc. (HOT) this week as a proxy for its peers.

HOT’s been down for four months running, having lost about 14 percent of its value. The first major downside target is $73.0. If that breaks, a freefall to $65 could ensue, but $70, or $67.5 form interim support. These prices are reflected in the retracement tables shown below
Big Hotel Small Chart
Retracements from Lows to $87.99


Since Friday, there’s been a small correction, but HOT declined today, August 11. $78 could be tested, and a close over next resistance at $81 would call for a recovery.

Starwood (HOT) Technical Indicators

Looking at the technicals, Starwood’s monthly chart generated a negative divergence back in April based on the KaseCD. Four down months have followed, but lows have not yet reached Kase’s first stop level at $72.83. The stop is near a key target, centered on $73.Big Hotel Chart
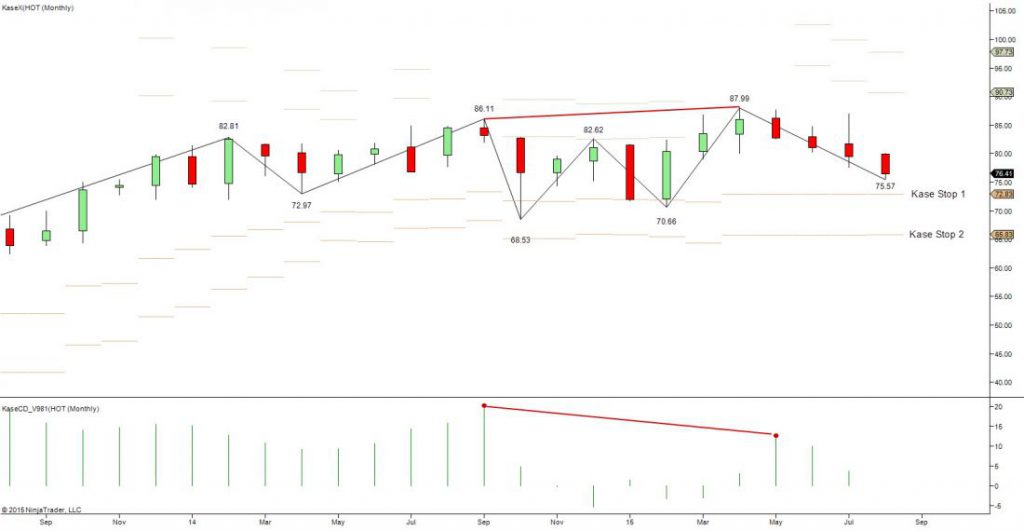
The first wave of a pattern is always the most important. Here that’s 87.99 – 79.53 – 86.96, the 1.62 extension for which is $73. If the pattern extends, look for $65, the trend terminus. This is just above Kase’s second stop at $65.8. The most recent wave is 87.99 – 79.53 – 86.96, and $73 is its equal extension as well as the Phi-squared corrective projection.

Backtracking, July 31 was an aberrant, outside, down day. Prices spiked to $86.96 only make a $77.72 low. $73 and $65 are targeted by this day’s waves.

The last four days through Tuesday for a Harami line with stars. The daily chart is oversold, but not divergent. Prices rose about $1.50 from $75.57, but fell today. The wave up targets $78, which is its equal extension, as well as its Phi corrective projection. The wave also targets $81, using three different calculations. This is the “drop dead” price above which the tone becomes positive, and the highest price to which the small wave projects. These two resistance values are the midpoints for the August (so far) and July monthly candlesticks.

Recommended Starwood (HOT) Trading

If I were short above $86, I’d just stay short, perhaps scaling out at $78 and then $81, and exercising caution at the downside targets. Bearish intraday traders might time in here, but watch $73, and use tighter stops. Technically there is little room for optimism, but if you’re long on fundamentals, then monitor the downside targets. Above $81 – you’re “hot”.

Connect with me on LinkedIn for more Market Updates.

VIX by Cynthia A. Kase

Read on TraderPlanet.com

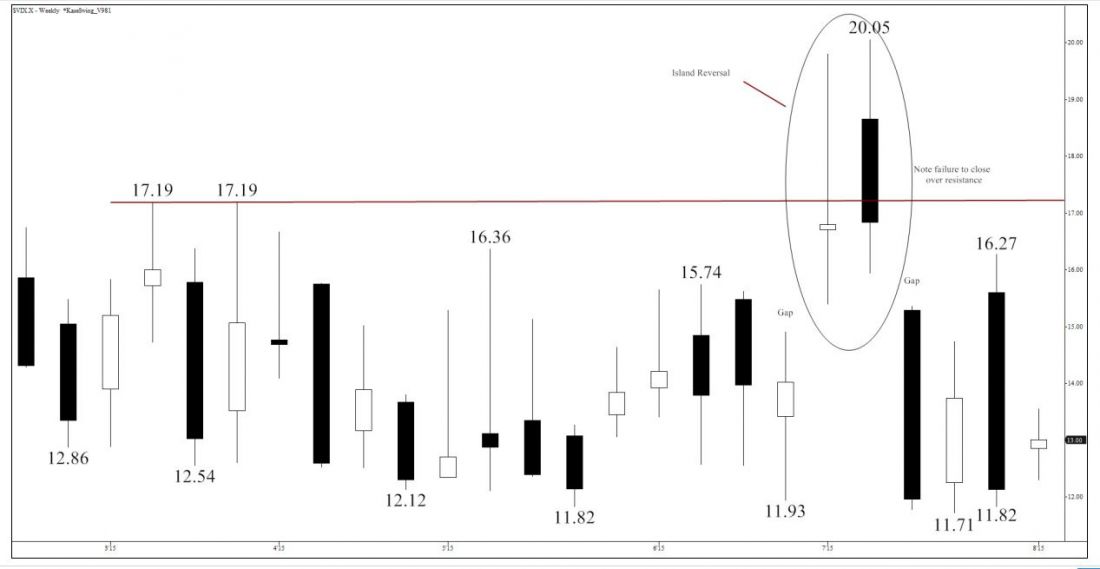
The CBOE Volatility Index, or VIX, has been chopping around erratically, oscillating between lows in the 11.4 to 11.8 range and testing highs generally in the mid to upper teens, but occasionally spiking fitfully into the low 20s. Resistance at 17.19 was tested twice earlier this year, and from late June to early July there was a two week spike that formed an island reversal, leaving first an up gap into the first week, and then a down gap following the second. The jump seems to have been due to market hysteria, (hence the nickname Fear and Greed Index) as opposed to real, supportive factors. Neither week closed over 17.19 resistance. Since then swing lows at 11.71 and 11.82 were made, with an intervening 16.27 high. This high failed to meet the top of the daily gap at 16.60.

VIX Trend Chart Charts created using TradeStation. ©TradeStation Technologies, Inc. 2001-2015. All rights reserved. No investment or trading advice, recommendation or opinions are being given or intended.

No Clear Trends for VIX

The VIX has oscillated up and down, sustaining a direction for no more than a couple of weeks or so, and failing to establish a trend or even a clear corrective pattern. On the very short-term charts, the activity since July 29 looks like a bearish correction, but that could mean little more than a retest of the lows.

The downside target ranges from 11.3 to 11.8 with a median of 11.5. If the small correction plays out in a standard manner, the swing low of 11.82 will be broken at least to some degree, with a slight bias towards hitting the lower end of the range. The reason is that earlier waves from 25.2 and 16.7 have extensions that calculate to 11.8. More recent waves from 13.55 and 13.22 drop that to about 11.4, which is probably the most likely outcome, but only marginally.

If the VIX were to surprise us by cleanly breaking and remaining below 11.3, then a retest of the historical 2006 low, around 9.3 would be called for, with interim support at 10.8. Given the irregular wave patterns, there’s nothing intrinsic in the structures calling for this to happen.

On the upside the crucial level is 14.4, the 62 percent retracement of the aforementioned decline, and July’s monthly open. 14.4 is highly confluent for the waves up from both 11.71 and 11.82. These also show targets at 17.5, just above the earlier 17.19 resistance. A sustained close over 14.4 if not contained by 17.5; would probably mean that more extreme values in the 24.5 area, become likely.

Recommended VIX Trading

If I were looking to get long the VIX, I would not allow myself to become overly “vexed” by a retest of the lows, and only would be concerned if there were sustained closes below 11.3. I’d look for a bounce from that retest, or if that doesn’t happen, a close over 14.4, to time in. Optionally, I might sell a put below 11.3 and buy a call above 14.4, or use those values as a base from which to set my range. Given the levels at which the VIX has traded historically, it has much more upside to vex the bears, than the reverse.

us dollarRead on TraderPlanet.com

By Cynthia A. Kase

On Tuesday pundits were aflutter because the US Dollar had an up day, pointing to expectations that the Fed would soon clarify its intentions to raise rates. Technically, Tuesday was a “star” with a very small range, an inside bar which closed well below Monday’s open. It was indicative, at most, of a wait-and-see stance.

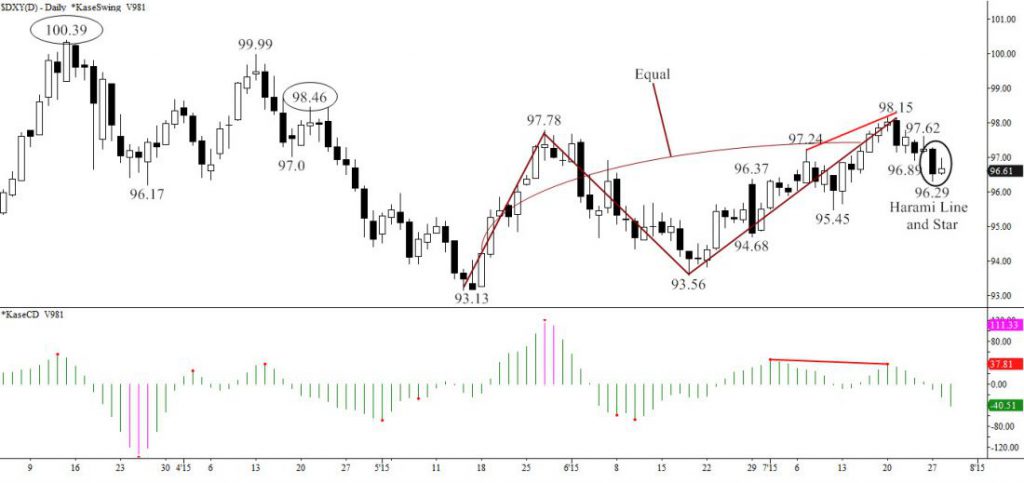
Technically, using the US Dollar index, DXY, the dollar, while not “in the doldrums”, isn’t yet robust. From a chart-driven standpoint, the market’s longer-term structure, viewed from March’s 100.39 high is negative. After five down days, prices are sitting on support. There must be a sustained close over 98.46 to give the dollar a boost.

The move up from 93.13 is a zig-zag abc pattern, where wave a equals wave c. Thus the upward correction could be complete having fulfilled a normal objective at 98.15. Also the second leg of the correction took 22 days, much shallower than the first at eight days. Put another way, it took almost three times as long for an equal increase in prices for wave c. The KaseCD momentum indicator exhibited a negative divergence at the July 21, 98.15 swing high.

us dollar chart

Charts created using TradeStation. ©TradeStation Technologies, Inc. 2001-2015. All rights reserved. No investment or trading advice, recommendation or opinions are being given or intended.

For a positive outlook, 95 must hold and resistance at 98.46 overcome, in which case, 100.39 is the target.

Here’s the scoop on 95. The first small wave down from 98.15 projects no lower than 95 as the trend terminus (98.153/97.112), 2*1.38 extension, and the corrective Phi3 projection. 95 is confluent as the daily Kase DevStop6 and weekly warning line.

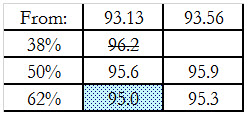
95 is the 62 percent retracement of the entire correction from 93.56, as shown in the table below. (As shown by the strike through, the decline has met the 38 percent retracement.) Finally the wave from April’s 98.46 swing high targets 95 as its minimum extension. So 95 is both a big target and major support. If broken, a decline to 91 becomes probable.

us dollar small

The downward pattern from 98.15, is also a zig-zag with equal waves. That’s supportive, as is the Harami star noted above, along with a bullish divergence on the KaseCD based on a 0.25 Kase Bar intraday chart. As noted, at minimum, 98.46 must be overcome for a recovery to come into view. This is not only the first swing high above 98.15, but also highly confluent for recent up waves. Very importantly it’s the next 1.38 extension for the wave 93.56 – 96.37 – 94.68 that’s already met and extended beyond its 1.0, equal to, objective.

Above 98.4, there’s some resistance at 99, but odds near certainty, then, for 100.39. This is the 1.38 extension (and Phi corrective projection) for wave a of the upward zig-zag pattern, and for the final up wave, 95.45 – 98.15 – 96.29. Above 100.39, the target’s 104.

It’s not yet time to “bet your bottom dollar” on DXY, but to watch the key levels and act accordingly!

“Ask Kase” and your question may be chosen as the subject of a future column (askkase@kaseco.com).


gold

Read on TraderPlaner.com

by Cynthia Kase

With the first increases in interest rates in over nine years looming, and the dollar strong, and gold supplies reportedly healthy, especially in China, gold is looking especially weak. After a strong decline on Monday, it bounced a bit on Tuesday, so, is it time to “go for the gold”. While fundamental pundits are hazy, technicals can polish up the outlook.

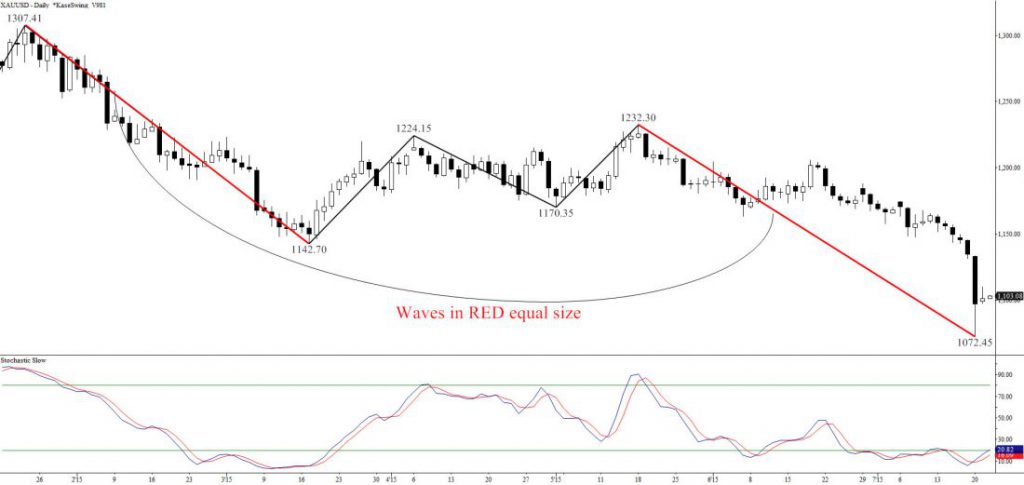
The current spot low is $1072.45 as shown on the daily chart below. This price constitutes the “equal to” extension of the wave down from $1307.41, and thus is strong support. The big down day on Monday was followed by a star Tuesday, which is bullish. Daily momentum is oversold, but mitigated somewhat by the lack of divergence, a turn signal.

XAUUSD Daily Chart with Equal Waves, Harami Star, and Oversold Stochastic

Charts created using TradeStation. ©TradeStation Technologies, Inc. 2001-2015. All rights reserved. No investment or trading advice, recommendation or opinions are being given or intended.


The major line of resistance is a confluent $1145, the equal extension for the bounce up from $1072.45, and the trend terminus, 2*1.38, and Phi3 corrective projection for the last reaction wave, $1094.35 – 1109.8 – 1098.26. $1145 is the Kase DevStop3 on the daily chart and warning line on the weekly. Whenever there’s such correspondence, the confluent value increases in importance. $1145’s also the 10 day and four week moving average. So $1145 is unlikely to be overcome without a significant clarification from outside influences. If and when this happens though, the next big target is $1222, then next key extension and also the 62 percent retracement from the $1307.41 swing high.

gold 3


On the downside, the chances of testing $1000 are highly dependent on whether support at $1045, $100 below resistance, is broken. If so, $1000 will have 2:1 odds.

$1045 is Kase DevStop4.5 on the daily chart, and $1000 on the weekly. $1045 is the lowest extension for the most recent wave down from Monday’s reaction high of $1119.10. Below $1045, targets from larger waves extending to $1000 are engaged. $1000 is the Phi2 corrective projection for the swing 1072.45 – 1119.1, and again for the swing 1142.7-1232.3.

Most importantly, the wave down from $1307.41 that has met its 1.0 projection at the current low, targets $1000 as its next, 1.38, extension.

For the optimists who went long on Monday or Tuesday, we’d suggest extreme caution until there’s a solid close over $1145. I’d use tight stops at previous swings around $1085 and $1075, but if you want to take more risk, $1065 is the critical target above $1045, and the key DevStop1 on the weekly.

If I were short, I’d stay short with stops at $1145 for now. This is about $70 up from the low. Should prices decline cleanly lower, I’d narrow my stop, first to $57, and then to $45, or use all three values for a scale-out exit.

Meantime, I’m expecting that if you keep your eye on the technicals, and are disciplined about exits, you’ll surely be golden.

Send questions for next week to askkase@kaseco.com, and for energy hedging visit www.kaseco.com.

Read on TraderPlanet http://www.traderplanet.com/commentaries/view/168639-ask-kase-core-commodity-crb-index-positioned-to-challenge-2015-low/by Dean Rogers

Read on TraderPlanet

The recent Chinese stock market downturn and depressed economic outlook by many economists for the second quarter and through year’s end for China’s economy has commodity prices backpedaling. Many components of the Thomson Reuters Core Commodity CRB Index, and the Index itself, have either fallen to new lows or are poised to test lows that were made earlier this year.

In addition, the nuclear deal with Iran also raises concerns about an increased oil supply glut, and energy is one of the most heavily weighted components in the CRB Index. In fact, on March 18, 2015 the CRB index fell to 206.13. This coincided with WTI Crude Oil’s $42.03 low. Both are on the teetering edge of challenging this year’s lows.

The question is: Will commodity prices and the CRB Index fall to a new low for 2015?

The gap lower from 224.107 on July 6th was the catalyst for the decline to 213.107. The wave 233.531 – 218.917 – 229.328 met its 1.00 projection at 213.107. This was also the 1.618 projection for the wave 229.328 – 221.095 – 227.473, and just below the 62 percent retracement from 206.813 to 233.531. The confluence of wave projections and retracements at 213.107 make it a decision point for a continued decline.

Taking out 213.107 would call for 203.5. The aforementioned waves down from 233.531 and 229.328 project to 203.5 as the 1.618 and 2.764 targets, respectively. This is also the 1.00 projection for the wave 227.473 – 213.107 – 219.898, and most importantly, the 0.618 projection for the large-scale wave 473.91 – 200.16 – 370.72. The importance of 203.5 make it a likely stalling point.

A sustained close below 203.5 would be the result of a deeply negative outlook for the global economy. In this case, the next targets would be 192.0 and 178.6.

CRB_Index.jpg

Charts created using TradeStation. ©TradeStation Technologies, Inc. 2001-2015. All rights reserved. No investment or trading advice, recommendation or opinions are being given or intended.

That said, the move up from 213.107 is testing resistance at 220.9. This is the 38 percent retracement from 233.531, near the bottom of July 6th’s gap, and the midpoint of April’s candlestick. A close over 220.9 will call for 227.5. This is key resistance because 227.5 is in line with the 227.473 swing high, the top of the gap at 224.107, the 62 percent retracement of the decline from 233.531, and the 0.618 projection of the wave 206.813 – 233.531 – 213.107. A close over 227.5 would open the way for 238.1 and 248.1.

The upward correction was preceded by daily bullish divergences on the KaseCD, MACD, and slow stochastic. In addition, a bullish morning star setup and hammer has formed on the weekly chart. These factors indicate the upward correction might extend to fill the gap and test 227.5 before the decline continue. Overall though, with all factors considered, 227.5 is expected to hold and odds favor a decline to 203.5.

Send questions for next week to askkase@kaseco.com, and for our weekly energy forecasts visit www.kaseco.com/services/energy-price-forecasts/.

hogsby Cynthia A. Kase

Read on TraderPlanet.com

After last year’s viral outbreak that killed millions of hogs, pork production, now having recovered, looks to set records and overshoot demand. Apparently some commodity advisors are panicking and recommending that their producer clients use lean hog futures to hedge and avoid even lower prices. Is this a good idea?

To our view, hedging hogs today would be like closing the sty door after the pig has fled. In Kase’s energy practice, producers hedge when markets are enjoying high prices, not when already painfully low. At this point, defensive measures are called for.

The reason I’d be a reluctant outright seller or short hedger is that prices have been rising over the past few weeks, not falling. Looking at the August 2015 contract, prices fell from a 95.35 high last November to a 71.175 low June 22. Then the KasePO and KaseCD momentum indicators generated bullish oversold and momentum divergence signals. A 71.275 swing low followed, forming a classic “W” shape, or double bottom.

lean hogs

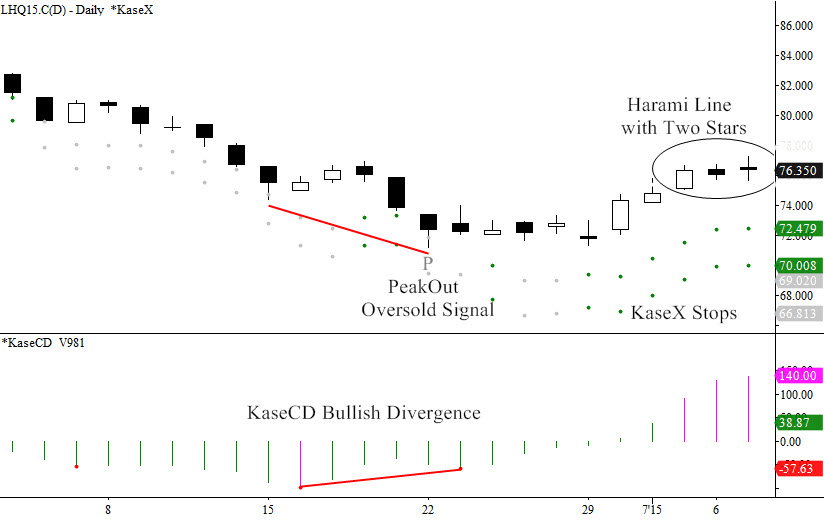
Last week’s candlestick completed a classic bullish morning star. However, the pattern remains unconfirmed until a close over 76.65, dampening the bullish tone. Also, the daily chart shows a potentially negative Harami line with two stars.

While the overall structure is down, the current 6 cent bounce could continue to 79 and maybe 81.5. A close over 81.5 hasn’t high odds right now, but if it happens we could see another 10 cents. 79 is the 2*1.38 extension and Phi2 corrective projection for 71.175 – 74.05 – 71.275. For the final wave up spanning from July 2 to July 7, 75.175 – 77.275 – 75.625, 79 is the 1.62 extension and 81.5 is both the trend terminus (77.2753/75.1752), and 2*1.38 extension.

If there isn’t a close over 76.65 soon, the rally might fail. A close below June 2s open, 75.15, followed by 72.4 would be cause for concern. A close below 70 could send lean hog prices squealing – potentially to 55 cents as, from a technical standpoint, targets ranging from 67 down to 55 have similar odds.

72.4 and 70 are KaseX stops. The key wave, 95.35 – 86.00 – 90.65, targets 70 as the important 1.62 extension. The last down wave, 77.275 – 75.625 – 76.625 targets 72.4 as the trend terminus (77.2753/75.6252), 2*1.38 extension and Phi3 corrective projection.

Here’s my hedging strategy. If you’re ok with “getting called”, sell calls above the market, maybe just above 81.5, perhaps purchasing puts on the downside with the funds depending on your risk appetite and whether you need to qualify for hedge accounting. Otherwise wait for a drop below 75.15 or so, then scale-in short calls maybe five cents or so above the market, again possibly buying puts. Meanwhile, grab a beer and a brat and watch the thresholds.

Send questions for next week to askkase@kaseco.com, and for energy hedging visit the Kase Energy Hedging Services page.

Charts created using TradeStation. ©TradeStation Technologies, Inc. 2001-2015. All rights reserved. No investment or trading advice, recommendation or opinions are being given or intended.

http://www.traderplanet.com/commentaries/view/168594-ask-kase-10-year-us-treasury-note/by Cynthia A. Kase

Read on TraderPlanet.com

Will the 10 Year US Treasury Note be Playing “Bass”?

As the 2H2015 commences, fundamental market analysts are lamenting the stock market’s prospects, pointing to low earnings and higher borrowing costs. US Treasury yield spreads are looking positive, which should be, in turn, negative for longer-dated fixed income instruments. So the key question is “will the 10-year note be playing ‘bass’ during the remainder of the year?” How low will the note go?

From a 131’05.5 January high, TY fell to 124’29 last Friday, June 26. There’s been a bounce these last two days, likely due to Greece. The decline has been choppy. It’s likely to extend and remain so.

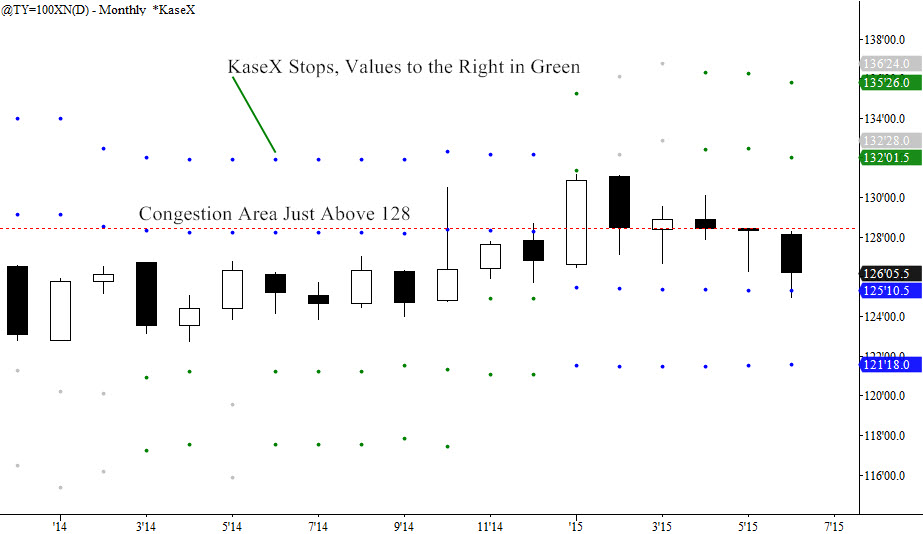
Major resistance is 128’0. This is the 1.0, or “equal” Fibonacci extension and the Phi corrective projection for the major wave up, 124’29 – 126’29 – 125’19. This also corresponds to KaseDev4.5 on the daily chart and KaseDev1 weekly.

In addition, 128’0 is the 50 percent retracement of the entire move down from 131’05.5, is an area of previous congestion, and right around June’s monthly high. Provided prices stay below 128’0, the downside looms. Should there be sustained close over this area, the targets are 129’16.5, 132’07, 135’30 and 136’26.5. Note how the KaseX stops show 132’01.5 and 135’26 as confluent on the monthly chart. Should the 129’16.5 be hit, the following targets might rapidly be reached. Again, this is not envisioned, but describes the lower probability outcome.

TY Monthly Chart with KaseX Stops and Congestion Area

Kase_TY_Chart

Charts created using TradeStation. ©TradeStation Technologies, Inc. 2001-2015. All rights reserved. No investment or trading advice, recommendation or opinions are being given or intended

Monday and Tuesday formed stars which are indicative of uncertainty given that the days’ opens and closes were close together. Also Tuesday’s closed only 1/32nd down from Monday. Monday’s high spiked over 127’0, filled the gap left on June 22’s open, but did not close within the gap, much less over. The two stars seem suspended above blank space.

The key supportive issue is that a price of 124’17.5, just below the current low, is highly confluent, being the 0.62 or 1.0 Fibonacci extension for many waves down from swing highs of 133’25, 130’40, and 128’10.5, and the 78 percent retracement, the next in line to be tested, of the entire move up from 122’22.5. It’s also the f corrective projection for the major wave 131’05.5 – 126’20 – 130’40. Technically, this is likely the main reason there’s been a bounce these last two days.

Nevertheless the probability of a break down to 122’26.5 is high, with 65 percent odds thereafter for 120’28 to form temporary support, and then for 118’07, which might hold, at least for a while. These latter three targets are the 1.62 Fibonacci extension, Phi2 corrective projection, and trend terminus of the very same wave, respectively.

So watch 128’0 and 124’17.5 for direction, with a bias to the downside.

Remember to send your questions for next week to askkase@kaseco.com. For more information about Kase’s services please visit www.kaseco.com.

Read on Traderplanet.com

by Cynthia Kase

Those of us who can remember KC and the Sunshine Band’s emergence in 1975 are now in need of a different kind of KC – coffee futures – to stay bright. Baby Boomers may be counted on to steadily drink the stuff, but it might be another kind of baby who might ultimately determine how much we’ll have to pay for it – El Niño.

The price of coffee futures for September delivery having made a high of 232 (cents) last fall, purportedly because of drought conditions, fell by almost half to make a 126.3 low in late May. Despite a bit of a bounce prices dropped to 127.9 last Friday. Having held May’s low is it now time to buy?

The National Oceanic and Atmospheric Administration apparently has identified El Niño conditions and is saying there’s a 90 percent chance the baby will stick around all summer, and maybe even into 2016. The possible effects on coffee are unclear as production in some regions could get a boost from wet weather offset by drought conditions elsewhere. Let’s see what the technicals say.

On the positive side, the monthly chart has a bullish Harami line and star. Also the wave patterns form a symmetrical, nested ABC pattern as marked on the chart.

In an attempt to break above earlier support at 135 (see green line), Tuesday’s 134.85 failed and gave back 6 cents thereafter. Prices, more or less have traded sideways for the past few days as circled. On June 10, an attempt to break 141, the bottom an old corrective pattern, also failed.

Dead sideways markets are difficult to call, but my bet is that 126.30 will be broken, and that there’s potential for 100.

The overall structure is down. Sustained closes above 141 will be needed to begin a reversal. This is not only the previous swing high, but also the 1.62 extension for the small wave up from 127.9, and Kase daily DevStop 3 and weekly warning line. Next is a highly confluent 150, the trend terminus, Y3/X2 value, 2*1.38 extension for the small wave, and 1.38 extension and f corrective projection for the wave up from 126.3.

On the downside, first support which must be definitively broken for a renewed bearish tone to take hold is 123.2, though the old 122.95 might become secondary support. Below this area, targets are 117.5, 109.5, and 100 – all confluent wave projections. Focusing on 100, that’s the 2*1.38 extension for the first wave down from 232 to 191.75, and the 1.38 extension for the next from 232 to 167.85, as well as a critical threshold as the weekly DevStop 3 value.

So unless and until coffee futures overcome resistance, watch each support level to see which might produce a reversal. Meantime, maybe relaxing to an old LP as you sip a cuppa joe is in order.

“Ask Kase” any question you may have about any actively traded security, and your question may be chosen as the subject of a future column (askkase@kaseco.com).

Remember to send your questions for next week to askkase@kaseco.com, visit www.kaseco.com, or check out Kase’s latest on www.wiley.com.


Read on TraderPlanet.com

by Cynthia Kase

Read on TraderPlanet.com

“Ask Kase” any question you may have about any actively traded security, and your question may be chosen as the subject of a future column (askkase@kaseco.com).

To an earlier generation the “Dorsey” brought to mind the famed orchestra leader and his acclaimed song, I’ll Never Smile Again. Followers of the tech market, though, will immediately think of Twitter’s interim CEO, Jack Dorsey. He’s just replaced Dick Costello, who, having been pressured by disgruntled investors, recently resigned.

Pundits point to reasons why Twitter’s been doing so poorly. Some blame mismanagement and complacency. Other tech-world doyens, compare Twitter’s user base, only about 20 percent of Facebook’s, and think there’s lots of untapped potential.

So the big question is – will Twitter ever “smile again”? Should one sell, buy, wait, or what?

Long positions became tenuous as sideways action in April followed a failure to overcome last October’s $55.99 high. When markets are dead-sideways, directional traders hold risk unrewarded. Any long positions should have been exited, if not on inactivity, then on stops, as, on the monthly chart, April completed an evening star pattern, with May confirming its demise.

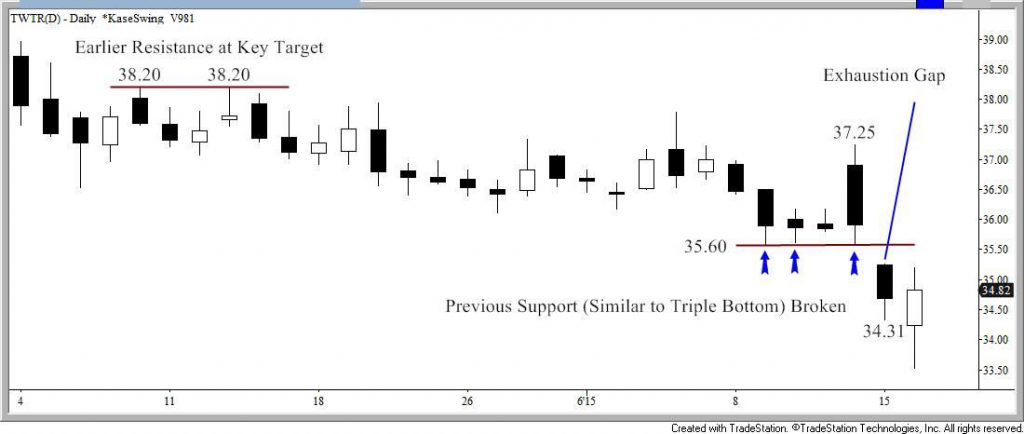
Bearish action accelerated with a down gap on Monday’s open and broke through a potential triple bottom around $35.6. Yet, the gap might be an exhaustion gap, and Tuesday traded about $1.70 up from its $33.51 low. Momentum indicators are set up for bullish divergence, which requires the low to hold and at least one up day to complete.

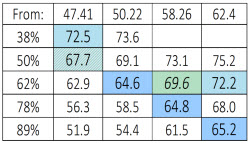
Tuesday’s low was the 0.62 projection of the key wave, $44.20 – 36.52 – 38.20, and is nearing a 38 percent decline from $53.49, and thus could form support. These are only glimmers of hope, but there’s no smiles as of yet.

Twitter Daily Candlestick Chart

Read on TraderPlanet.com

If you’re looking for a buy, I’d wait and watch for $36, $38.25, and $39 and get in on closes over, depending on how aggressive you are, or use all three, scaling in. These levels are just above Kase’s daily DevStops 2 and 6, and weekly warning line, respectively, with two latter May’s midpoint and open. Tuesday’s up wave, 33.51 – 35.20 – 34.61, targets $36 as the 1.0 Fibonacci extension and f3 corrective projection, and $39 as the trend terminus (35.203/33.512) and (2*1.38) extension. All three thresholds are important retracements, with $38.2 the critical 21 percent retracement of the entire move down from $55.99.

Retracement Table Down to $33.51

Read on TraderPlanet.com

For the unsmiling, provided $35.6 holds on a closing basis, I’d sell into an intraday decline and hold tight stops until safely below $33.2, at which time scaling up to a higher intraday or daily chart would be okay. I’d continue to monitor risk very closely as there’s support at $32. Below that I’d hang short, watching action closely at confluent Fibonacci extensions of $30.8, $27.7 and $25.5, with the major downside target $23.8.