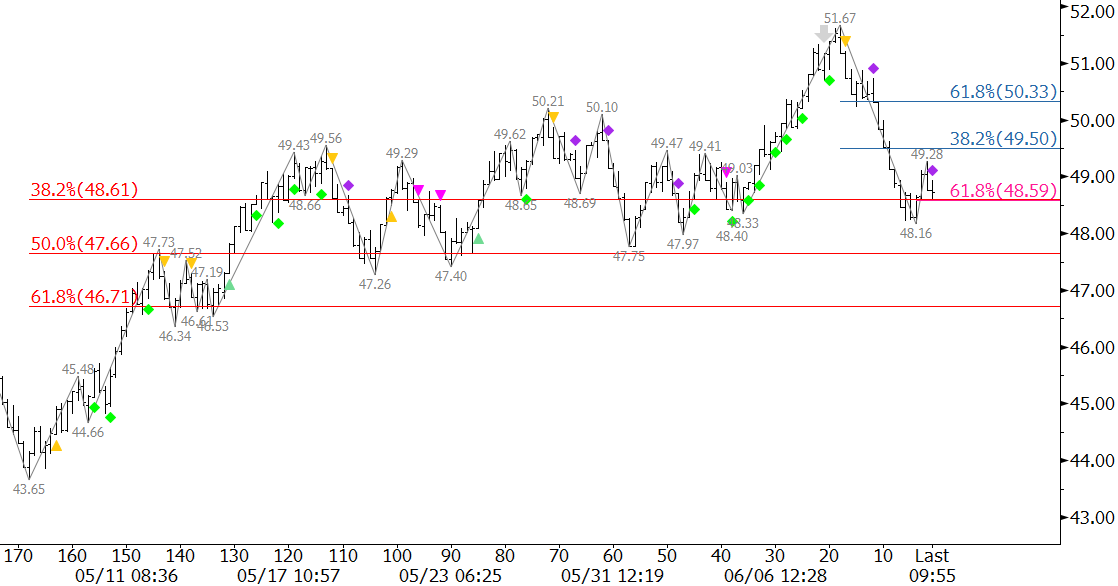
August natural gas pushed to new highs Tuesday and early Wednesday before stalling at $2.974. Cooler than previously expected near-term temperature forecasts are reportedly the culprit for Wednesday’s pullback and settle at $2.863.
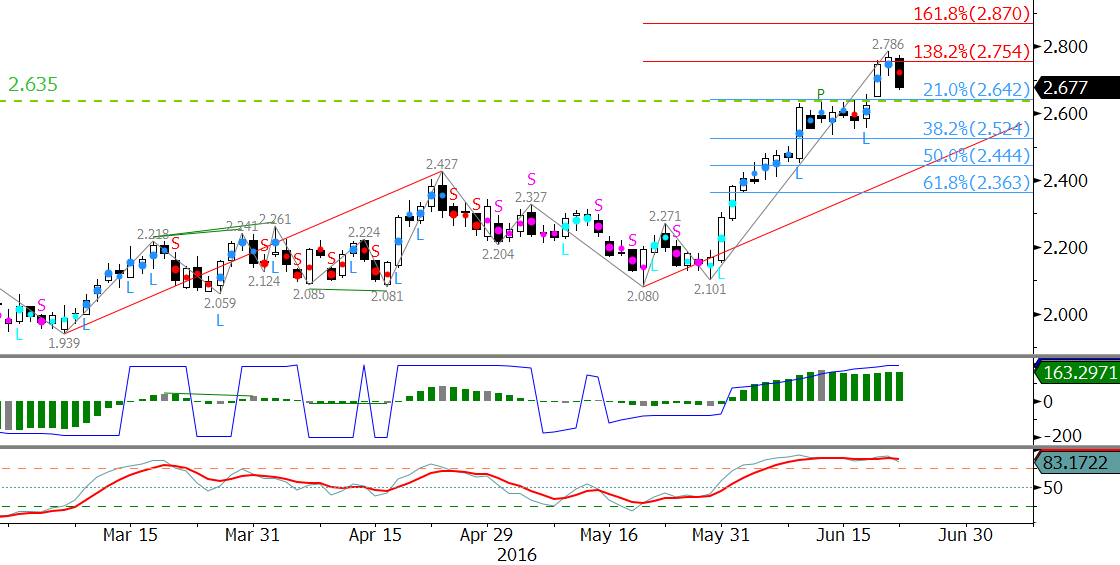
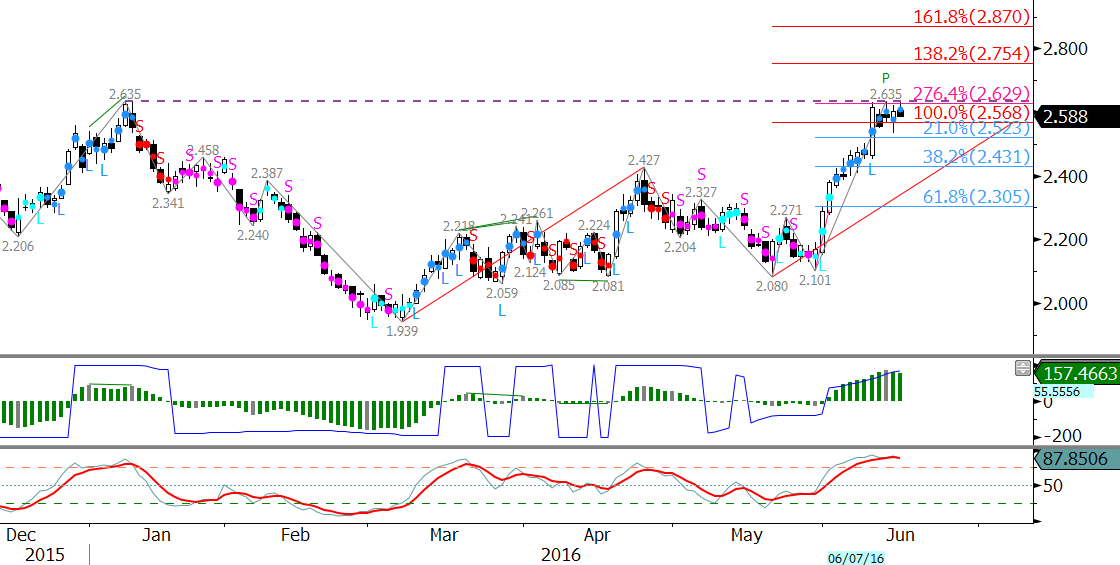
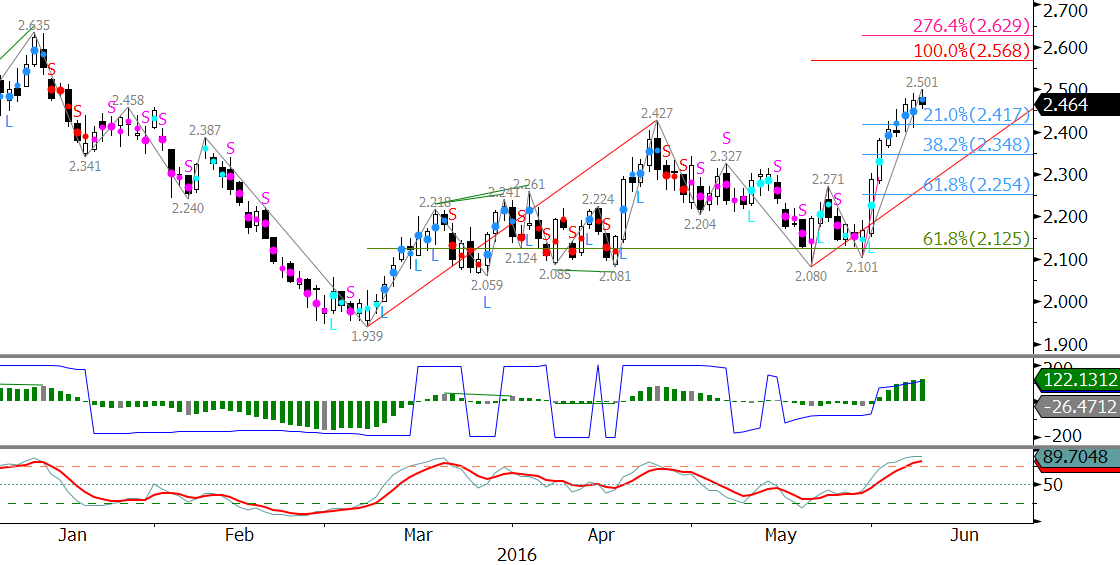
Longer-term, the outlook for natural gas is positive and is most likely forming a five-wave trend. The move up is due for a significant correction to form a potential Wave IV. Momentum is setup for bearish divergence. The Stochastic has also crept its way below the overbought threshold.
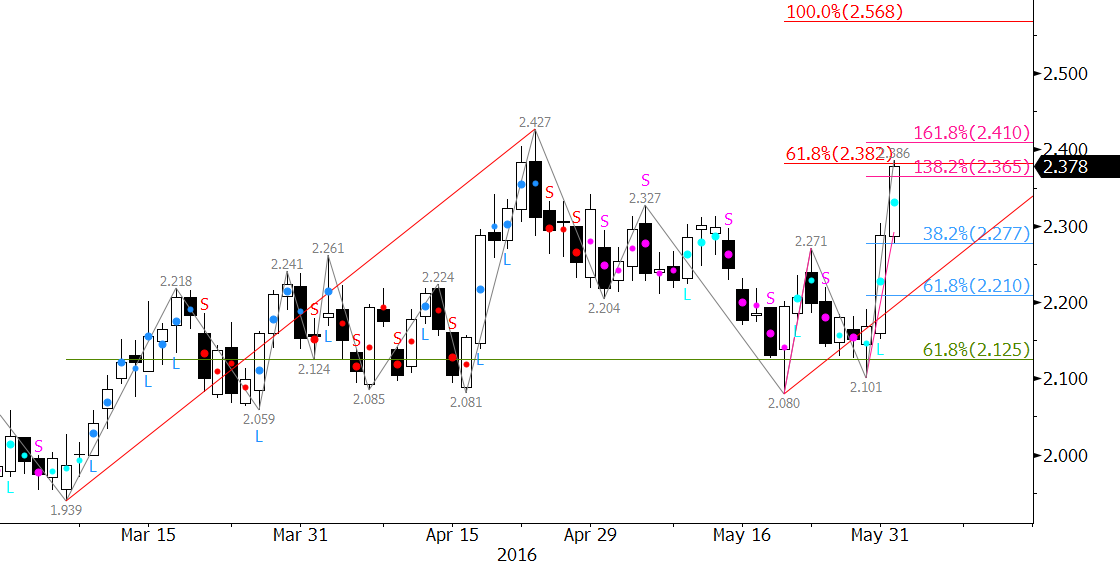
Charts show that August natural gas met a cluster of important wave projections at $2.974 Wednesday morning. The most significant was the 1.618 projection of the primary wave $1.99 – 2.494 – 2.157. It is rare for a primary wave such as this to extend beyond the 1.618 projection without a significant correction first.
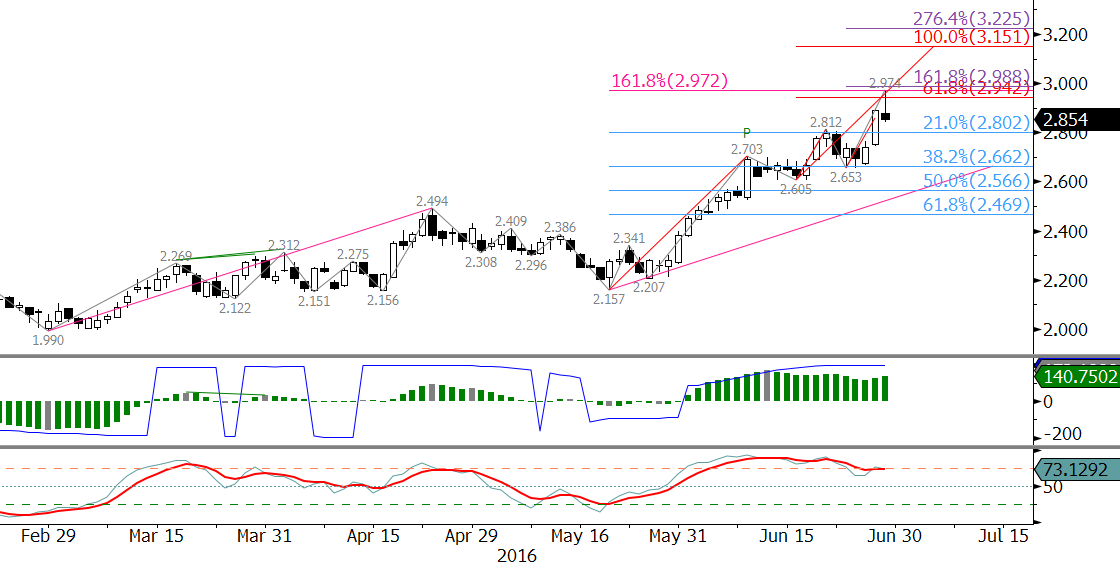
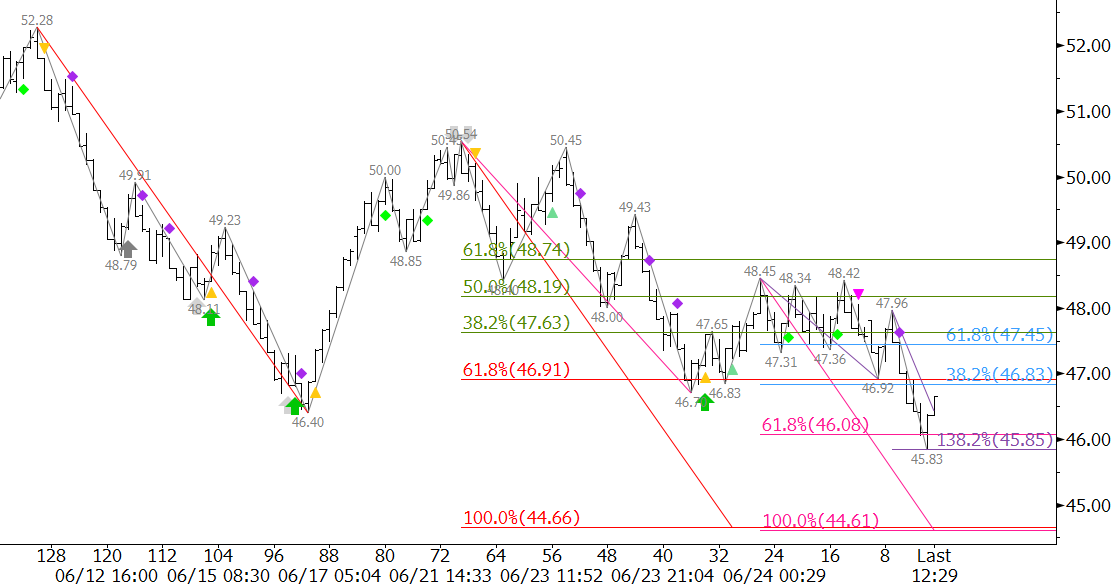
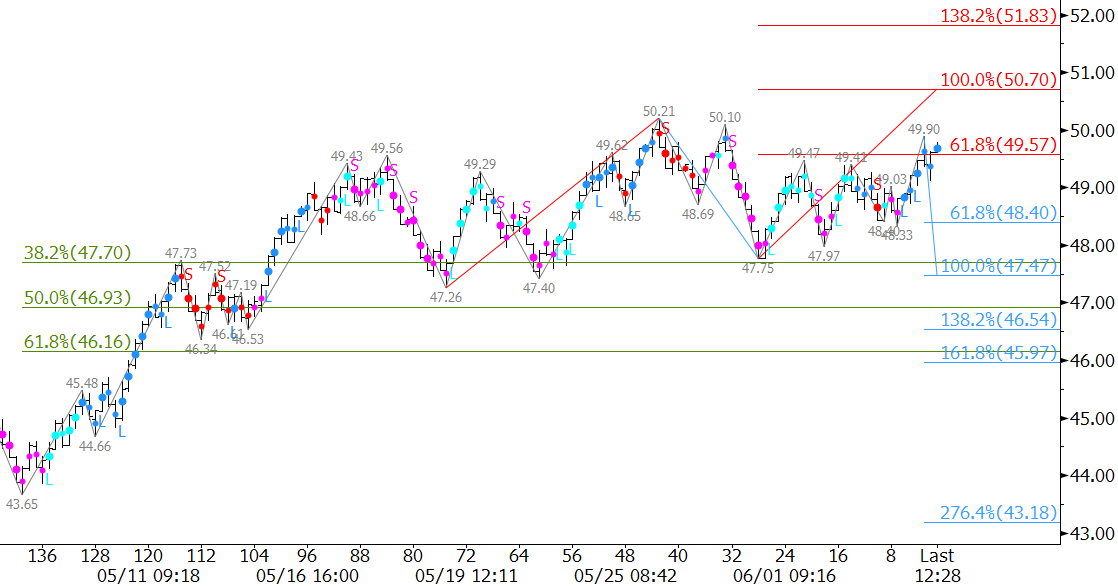
The pullback from $2.974 forms a daily shooting star. This reversal pattern would be completed upon a close below Tuesday’s $2.82 midpoint and confirmed upon a close below the $2.751 open. This would then open the way for $2.66, the 38 percent retracement from $2.157 to $2.974.
This is a brief natural gas forecast for the next day or so. Our weekly Natural Gas Commentary is a much more detailed and thorough analysis. If you are interested in learning more, please sign up for a complimentary four-week trial.