Natural Gas Forecast: Looking for a bottom? So is everyone else.

By Dean Rogers

This is the time of year when everyone is looking for a bottom and pre-winter rally for natural gas. The logic and seasonal timing make sense, but picking bottoms is a dangerous game. Those that successfully time the bottom are more lucky than good. The best that most mere mortals can hope for is to be prepared for the turn so that they can react in an effective manner that fits their goals, strategy, and risk appetite.

This is why it is important to have a forecast and directional opinion (and yes, sideways is a direction) about the market in addition to a set of reliable indicators like Kase StatWare or KaseX to time entries and exits. The forecast is the framework for the market that lets you know where key support and resistance are and when you can expect correction and potential trend reversal. Indicators tell you when to get in, where to place stops, and when to get out.

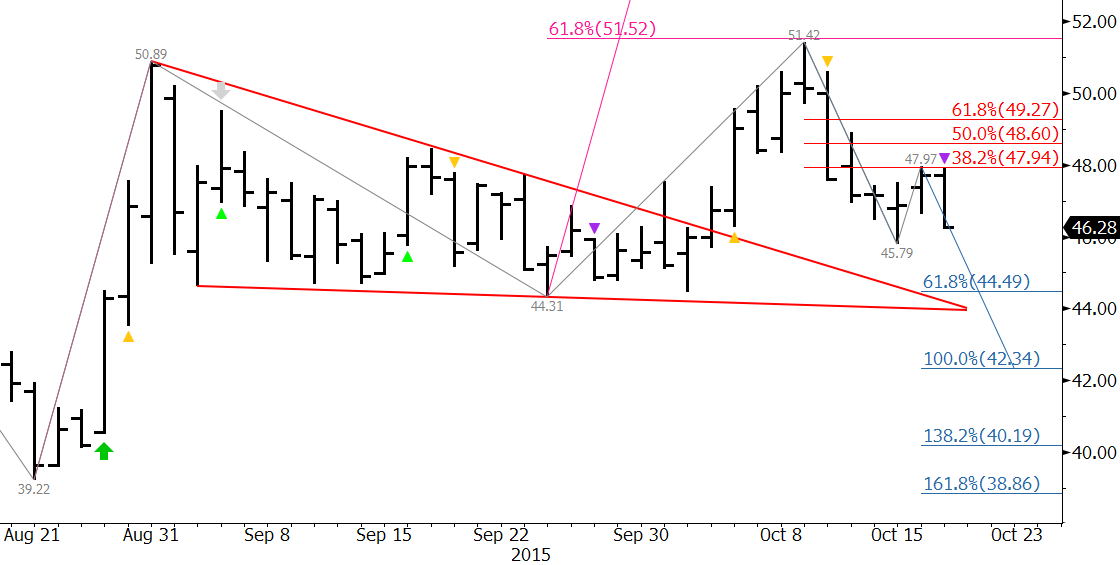
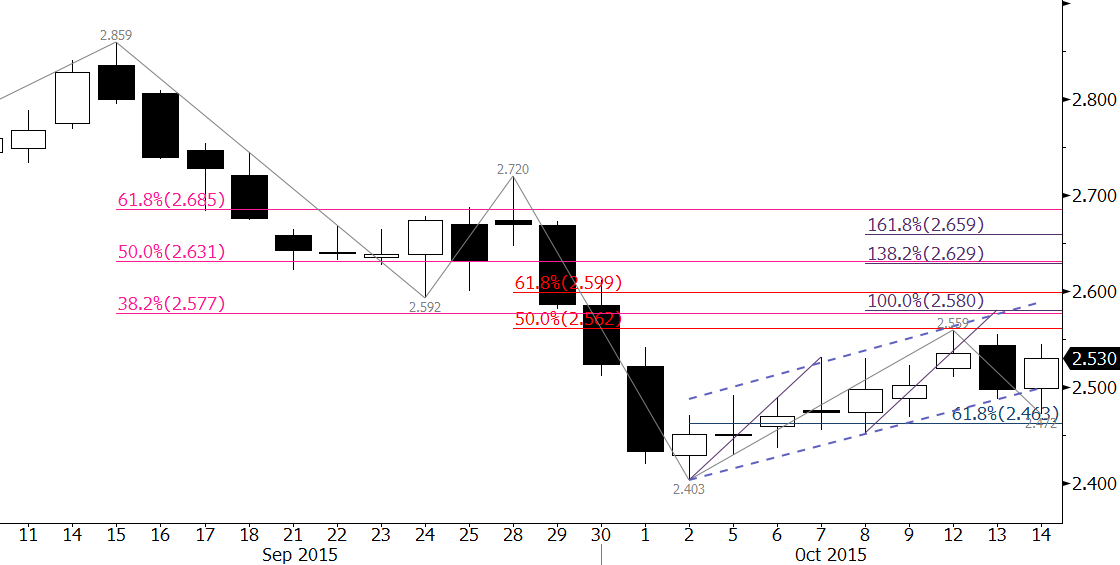
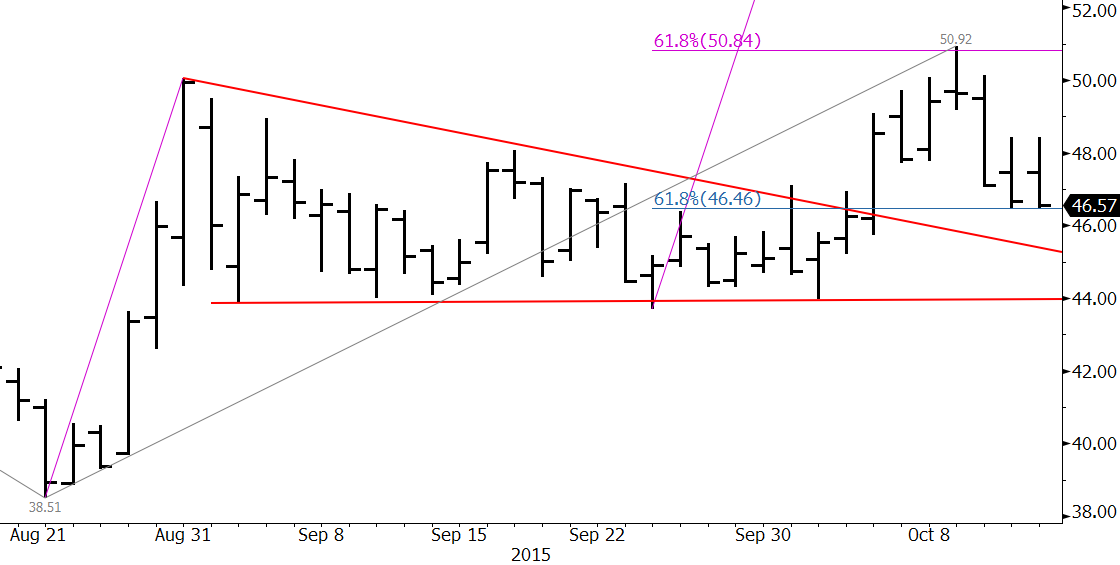
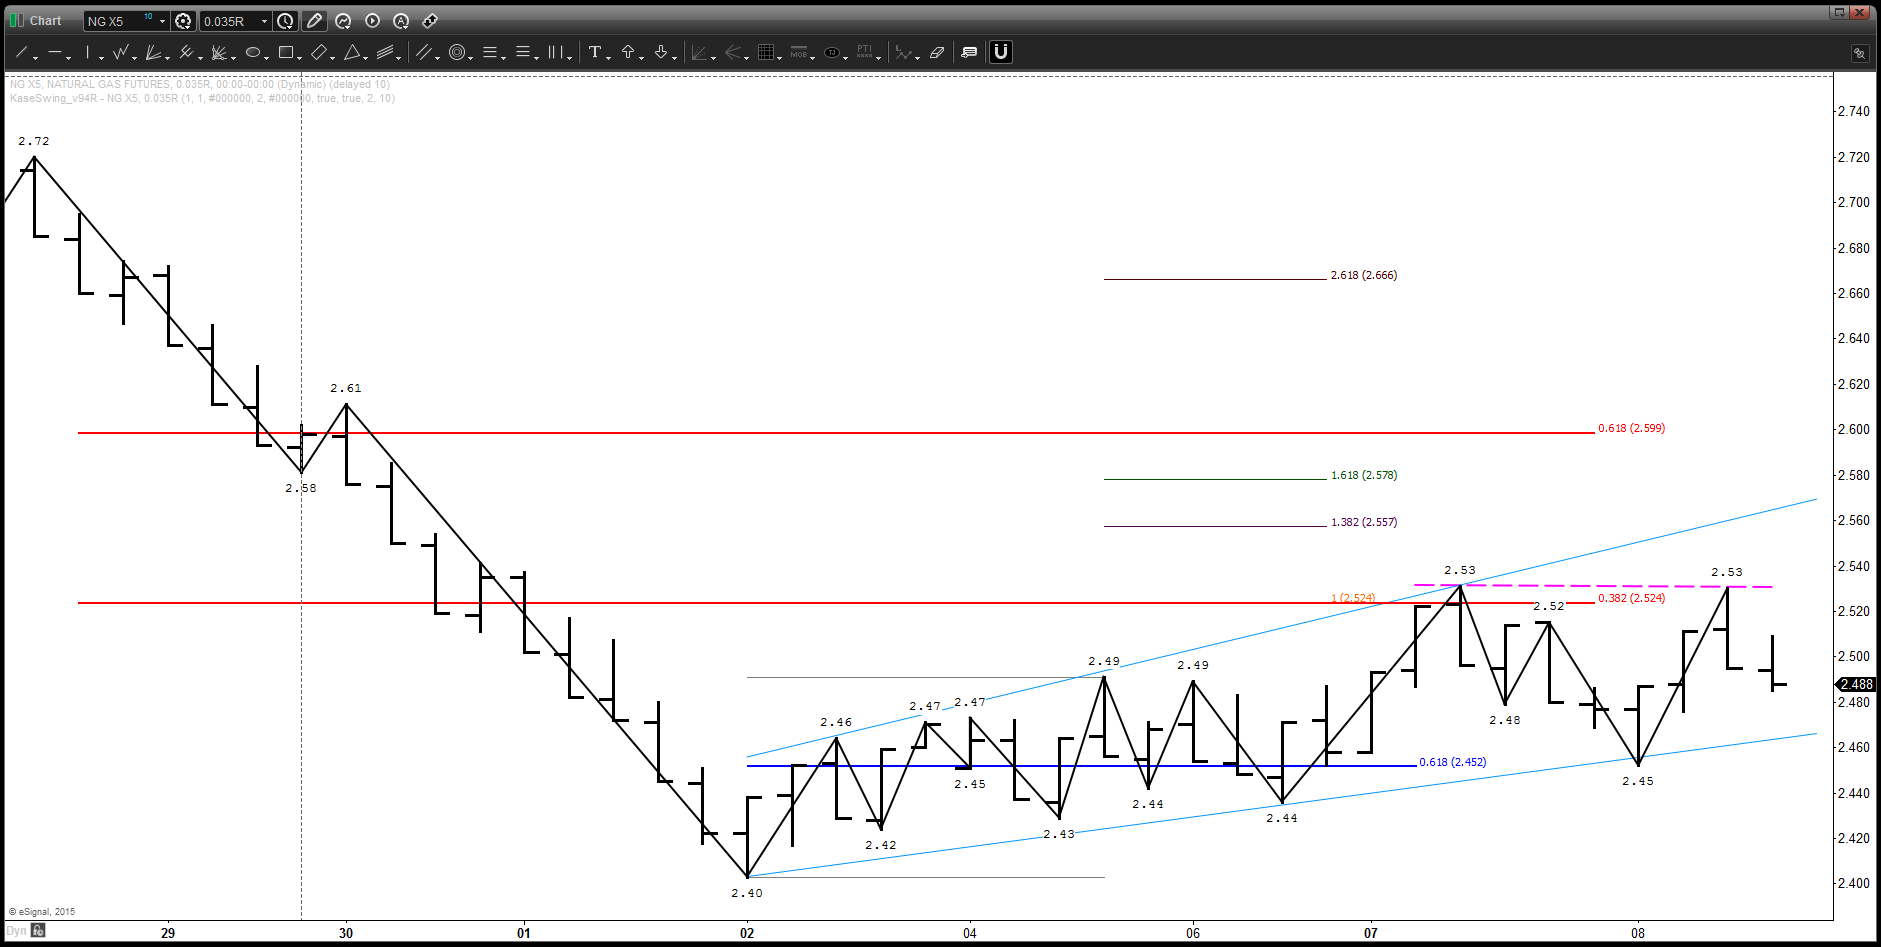
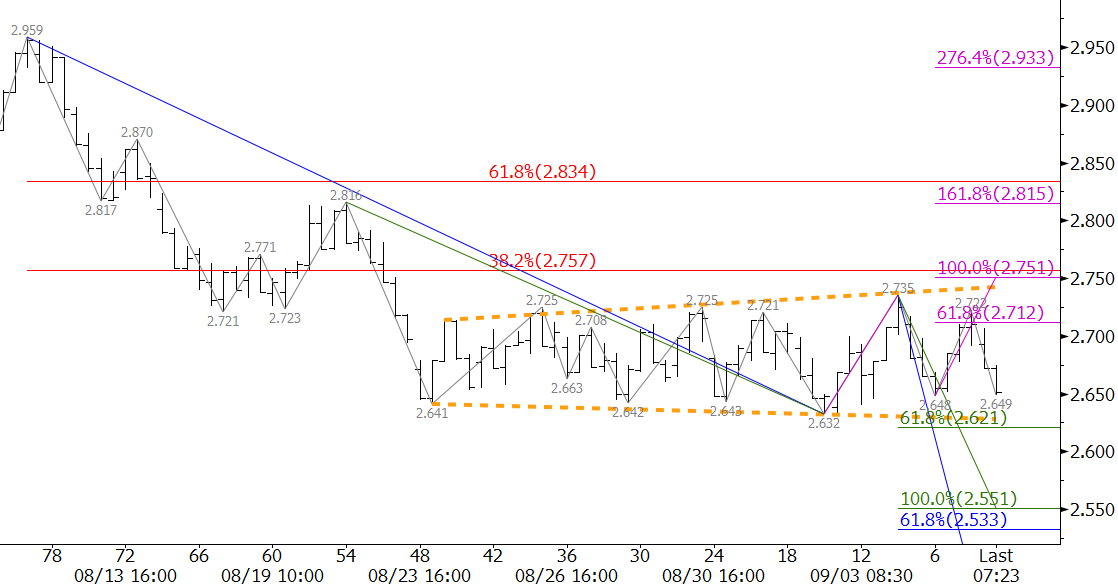
For instance, $2.40 was major support for November natural gas. This was a highly confluent target, and we had discussed this level as a potential stalling point for many weeks (even months) leading up to the decline to $2.403 on October 2. However, the subsequent move up was shallow, choppy, and corrective. Long trades could have been taken on shorter bar lengths during the corrective move up, but in our detailed weekly forecasts and mid-week blog updates we anticipated another decline and test of $2.40 because the market was struggling to overcome key resistance levels at $2.48 and $2.59.

November fell to $2.41 on October 16 and started to bounce again. The move stalled at $2.50 on Tuesday, October 20 and prices fell to new lows for November and the winter contracts on Wednesday, October 21.

NGX5 20151021

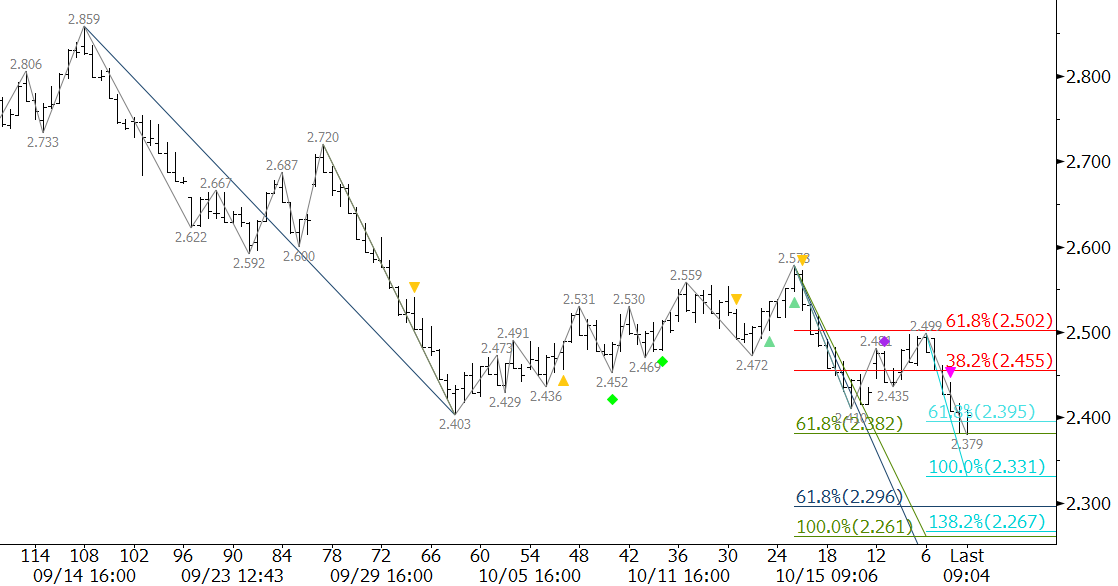
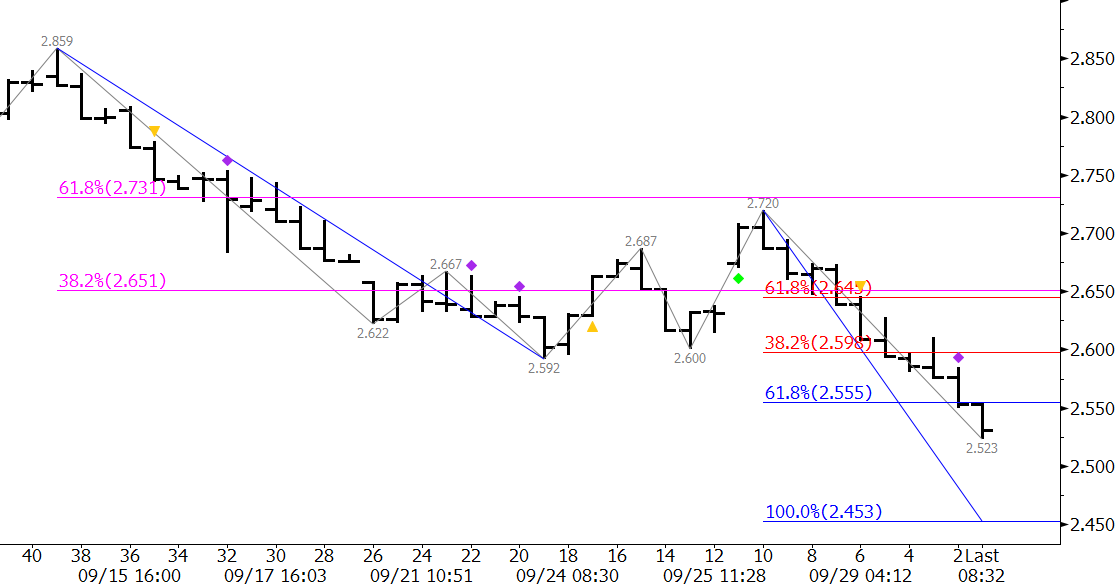
$2.40 has held so far on a closing basis, but a sustained close below this level will open the way for at least $2.33, the 1.00 projection for the wave $2.578 – 2.41 – 2.499 and very likely $2.27. The latter is a confluent objective for the waves down from $2.859, $2.72, and $2.578 making it the next potential point at which a bottom could be made.

Most technical factors are negative and there is little evidence that the decline is going to stall. However, the importance of support at $2.33 and especially $2.27 indicate that we should be prepared for at least another correction and a potential bottom soon. Keep a close eye on your indicators to tell you when to time your entries and watch for closes above key resistance levels to confirm the move down has ended.

For now, initial resistance is $2.45 and key resistance, for the near term, is $2.50.

This is a brief natural gas forecast ahead of tomorrow’s EIA report. Our weekly Natural Gas Commentary is a much more detailed and thorough analysis. If you are interested in learning more, please sign up for a complimentary four week trial.

By Dean Rogers

December WTI’s wave $39.22 – 50.89 – 44.31 met its 0.618 projection at $51.42. This was positive, especially due to the break higher out of the bullish pennant formation. We anticipated the pullback from $51.42, but so far it has been stronger than expected and is poised to test major support levels at $46.0 and $44.3.

Kase’s studies show that waves that meet the 0.618 projection extend to the 1.00 projection 80 percent of the time. This would have pushed prices to $56.0. However, the pullback from $51.42 has been strong and closed below $47.0 support on Monday. Therefore, this may be 20 percent of the time that a wave fails to meet its 1.00 projection.

CLZ5 20151019

First support is $46.0, and a close below this would open the way for $44.31. This is the swing low of the wave up from $39.22 and is in line with the 0.618 projection of the wave down from $51.42. Taking out $44.31 would result in a technical failure of the move up and call an extremely bearish outlook for foreseeable future.

Look for immediate resistance at $46.9, $47.6, and then $48.4.

This is a brief analysis and outlook for the next day or so. Our weekly Crude Oil Commentary is a much more detailed and thorough energy price forecast. If you are interested, please sign up for a complimentary four week trial.

By Dean Rogers

Spot natural gas is still looking a bit unsure of the move up, but the forward months, especially the winter strip, are looking reasonably positive. This likely indicates that a longer-term move up is underway, but for now it is looking like the prompt month could settle into a choppy trading range while it awaits more data (weather) to push natural gas prices higher or lower.

November futures stalled at $2.559 before reaching crucial resistance at $2.57. Tuesday’s bearish engulfing line was followed by a positive move on Wednesday. Resistance at $2.57 should be tested. A close over $2.57 would call for $2.63 which then connects to $2.68. First support is $2.49, but the key level for the near-term is near $2.43. A close below this would confirm the move up has failed and would open way for a new low.

NGX5 20151014

This is a brief natural gas forecast ahead of tomorrow’s EIA report. Our weekly Natural Gas Commentary is a much more detailed and thorough analysis. If you are interested in learning more, please sign up for a complimentary four week trial.

By Dean Rogers

Last week’s break higher out of the bullish pennant was positive and the move up extended to meet the 0.618 projection of the wave $38.51 – $50.04 – 43.71. However the move stalled there, formed a bearish evening star and blow-off high, and then proceeded to test $46.4, the 62 percent retracement of the move up from $43.71.

CLX5 20151013

The market is telling us that it needs more time to sort itself out as it awaits more data. We have stated that the move up would likely be a grind higher, and so far that has been the case.

For now, another trading range will likely form between $46.4 and $50.0. Look for resistance at $47.4 and $48.2.

Should prices fall below the $43.71 swing low the outlook will shift back to negative for the longer-term.

This is a brief analysis and outlook for the next day or so. Our weekly Crude Oil Commentary is a much more detailed and thorough energy price forecast. If you are interested, please sign up for a complimentary four week trial.

By Dean Rogers

November natural gas had worked its way higher to challenge key resistance at $2.53 over the past few days after meeting major support at $2.403 last week. The move up has been shallow and choppy compared to the decline and could be interpreted as a bearish expanding wedge. The market also keeps giving back its intraday gains at the end of each day, which indicates hesitance to continue higher. This point is emphasized by the formation of an intraday double top at $2.53.

NGX15 20151008

The completion point for the double top is $2.45, which is also in line with the wedges lower trend line. A close below this would confirm the double top and a break lower out of the wedge, opening the way for another test of $2.40 and possibly lower.

That said, a few positive factors, including bullish daily divergences and a morning star still show that the upward correction could extend to $2.60. The key for a move of this magnitude is for $2.45 to hold and a close over $2.53. The latter is the morning star’s confirmation point, the 1.00 projection for the wave $2.403 – 2.491 – 2.436, and the 38 percent retracement from $2.72 to $2.403.

On balance, with all factors considered, it is looking more and more like natural gas will settled into a trading range between $2.40 and $2.53 for a few weeks while awaiting external factors (weather) to sort out the direction for the next few months.

This is a brief natural gas forecast. Our weekly Natural Gas Commentary is a much more detailed and thorough analysis. If you are interested in learning more, please sign up for a complimentary four week trial.

By Dean Rogers

For the past few weeks each bit of positive crude oil news or fundamental data has seemingly been offset by something negative. As a result, November Brent has settled into a rectangle formation with boundaries between $47.0 and $50.3.

The upper boundary of the rectangle is poised to be challenged after Monday’s move up to $49.87. The pullback at the end of the day indicates another oscillation lower might take place first, but for now, odds still favor a break higher. A close over $50.3 would call for at least $51.7.

Main20151005152653

Conversely, Brent’s move up has already failed once after breaking higher out of a bullish pennant on September 15. Since then the rectangle has formed. Should the rectangle fail, and prices close below $47.0, look for at least $45.3.

This is a brief analysis and outlook for the next day or so. Our weekly Crude Oil Commentary is a much more detailed and thorough energy price forecast. If you are interested, please sign up for a complimentary four week trial.

By Dean Rogers

November natural gas closed below major support at $2.63 Tuesday and then settled below $2.55, the 0.618 projection of the wave $2.859 – 2.592 – 2.72 Wednesday. Most waves that meet the 0.618 projection extend to at least the 1.00, in this case $2.45. Therefore, odds favor $2.45. This is a highly confluent target that is in line with this year’s $2.443 perpetual swing low. Many factors make $2.45 a potential stalling point. At minimum, we expect a pullback once $2.45 is met.

natural gas

First resistance for tomorrow is $2.55. Resistance at $2.59 should hold. The key level for the near term is $2.64. This is the 62 percent retracement of the decline from $2.742 and the 38 percent retracement from $2.859.

This is a brief natural gas forecast ahead of tomorrow’s EIA report. Our weekly Natural Gas Commentary is a much more detailed and thorough analysis. If you are interested in learning more, please sign up for a complimentary four week trial.

By Dean Rogers

After the late August rally WTI settled into a narrowing range that forms a pennant. This is a continuation pattern that indicates odds favor a break higher. However, these odds are somewhat dampened due to the price rise that took place before their formation was small in comparison to the size of the formation. In addition, more than half of the price rise has already been eroded.

wti crude oil

The small wave up from $43.71 indicates that a close over $46.0 would call for $47.0, which is in line with the top of the pennant.

We like support at $44.1 to hold, but $43.0, near the 62 percent retracement of the move up, is the key for a negative outlook.

On balance, even if prices break higher or lower out of the pennant, we could see crude oil continue to oscillate in a wider range for another few weeks while the market sorts out fundamental and geopolitical factors.

This is a brief analysis and outlook for the next day or so. Our weekly Crude Oil Commentary is a much more detailed and thorough energy price forecast. If you are interested, please sign up for a complimentary four week trial.

By Dean Rogers

Natural gas had oscillated in an expanding triangle since August 24. Monday’s break higher out of the pattern was positive, but stalled at $2.794, the 50 percent retracement from $2.959 to $2.632.

The move to $2.794 was healthy because the decline had become stale. The rally gave bears a new opportunity to short the market.

Tuesday’s close below Monday’s $2.73 midpoint formed a daily dark cloud cover (bearish), and Wednesday’s close below $2.70 confirmed the pattern. This is also in line with the 62 percent retracement from $2.632 to $2.794.

natural gas

Caution is warranted and trading will likely remain choppy, but the bearish technical factors indicate another test of $2.63 is expected. A close below this would open the way for the decline to $2.55 and lower have expected for several weeks.

This is a brief natural gas forecast ahead of tomorrow’s EIA report. Our weekly Natural Gas Commentary is a much more detailed and thorough analysis. If you are interested in learning more, please sign up for a complimentary four week trial.

By Dean Rogers

Last week we stated WTI and Brent would likely settled into trading ranges while sorting out longer-term fundamental factors and the late August price surge. That has been the case, and so far the oscillations have formed a flat descending triangle for WTI and a pennant for Brent.

WTI and Brent patterns

Both patterns are bullish, but have a higher than normal probability to fail in our opinion. Even upon a break higher we do not expect a bullish rally to ensue, but rather a test of the recent swing highs.

Should the patterns fail look for major support at $42.6 for WTI and $46.7 for Brent. In other words, we think the trading range will continue to form between approximately $42.6 and $49.0 for WTI and $46.7 and $52.0 for Brent.

This is a brief analysis and outlook for the next day or so. Our weekly Crude Oil Commentary is a much more detailed and thorough energy price forecast. If you are interested, please sign up for a complimentary four week trial.