WTI crude oil fell sharply last Thursday after OPEC and other major producers announced an extension to production cuts through March 2018. This was expected by most, and according to media, the decline was due to disappointment that production cuts were not deeper, which many had hoped for.
U.S. shale production remains a concern, though stockpiles fell for a seventh straight week, a fact that many have seemed to overlook. In addition, some are reportedly wondering what OPEC’s plan for an exit strategy to the production cuts will be without flooding the market with supply again.
For now, the extension of the OPEC cuts has become a game of “wait-and-see”. They will undoubtedly have a longer-term impact on prices, but at this point, it is hard to tell how significant the impact will be.
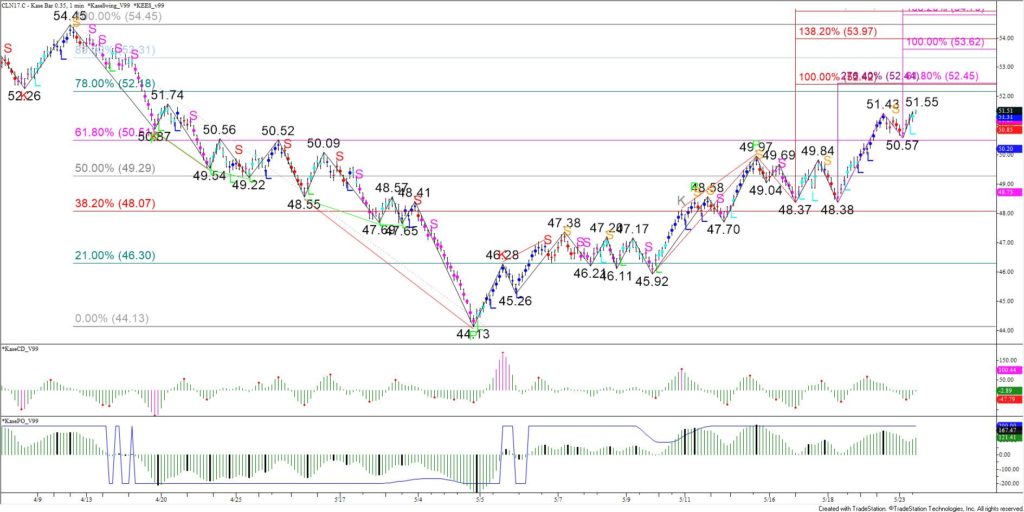
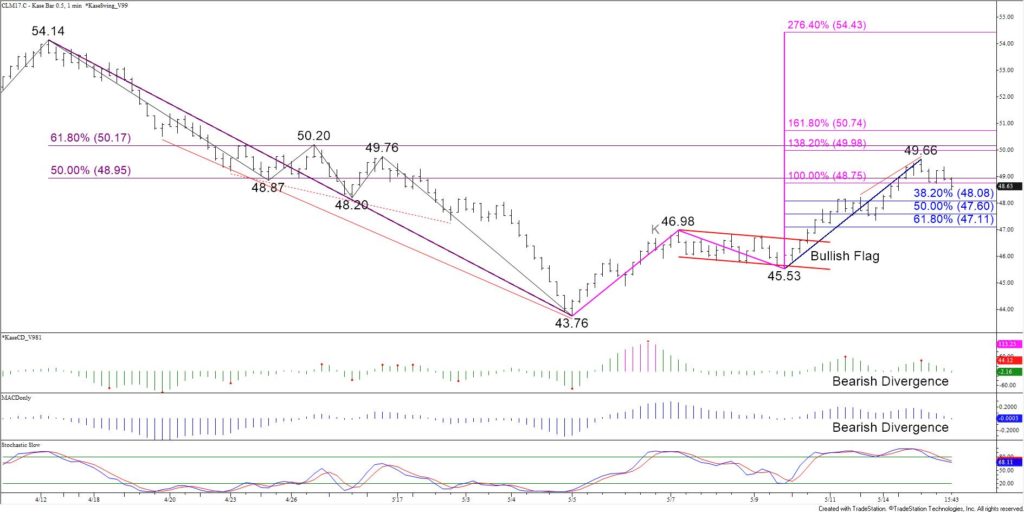
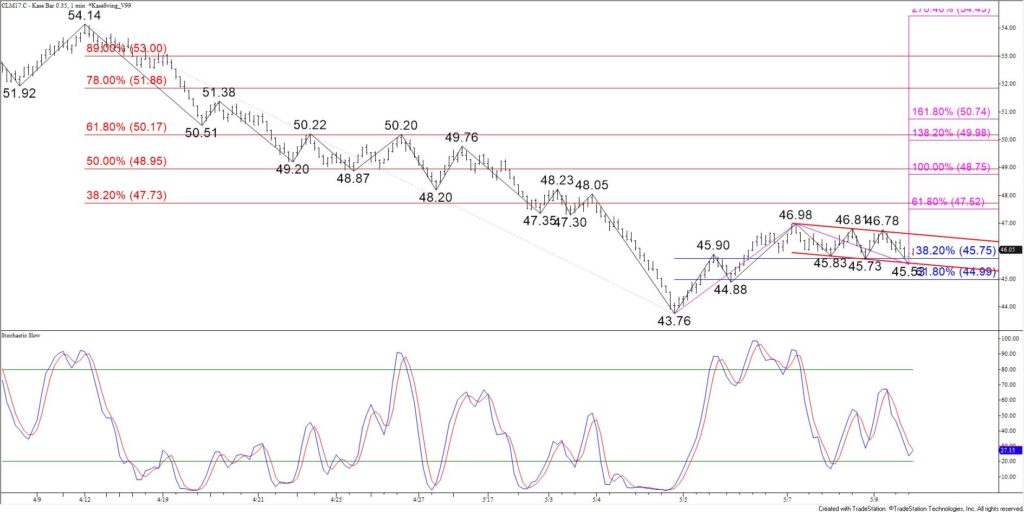
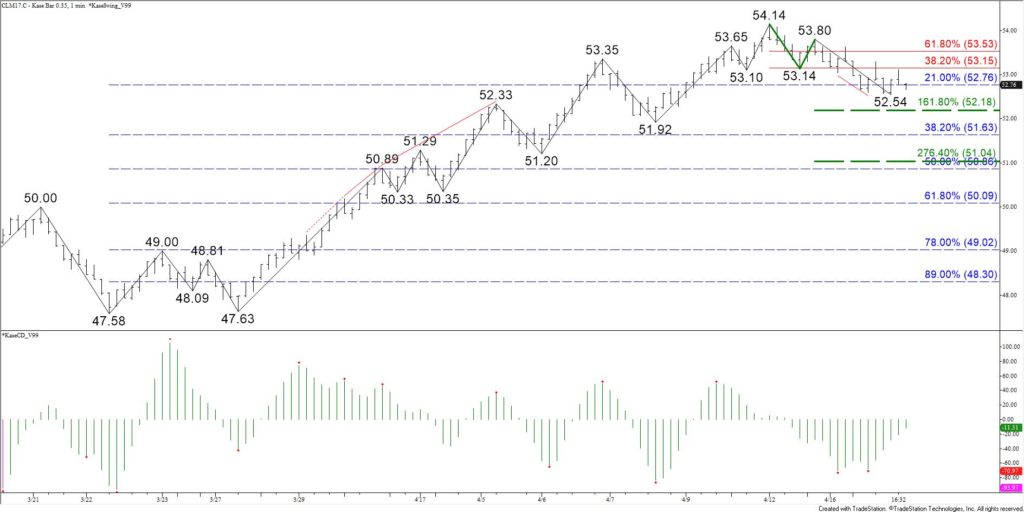
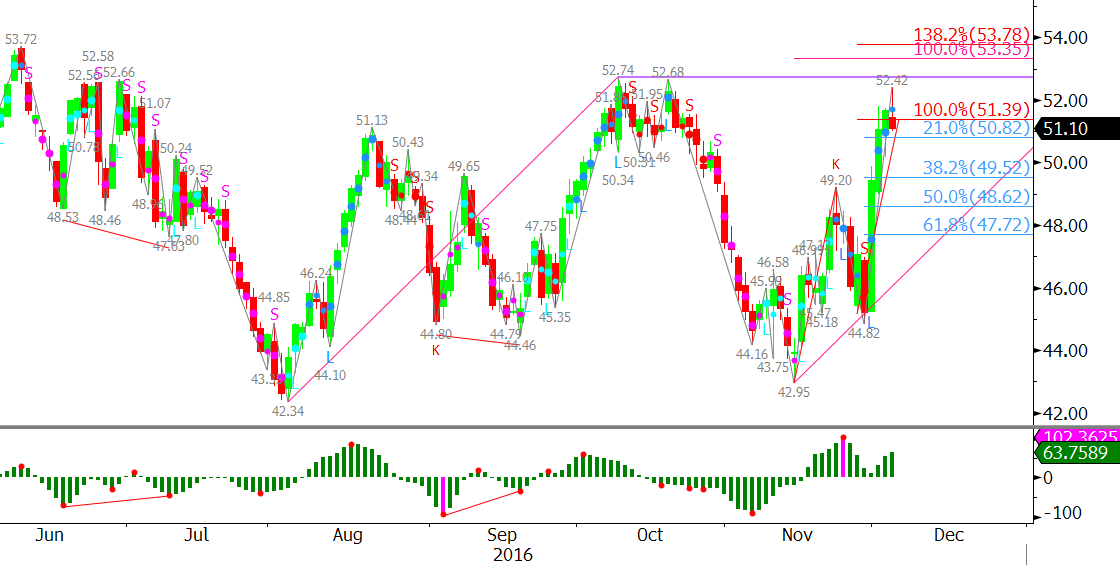
Most technical factors are negative, though it is still a tight call. July WTI made up some ground since falling late last week. However, the formation of a head and shoulders pattern is negative for the near-term outlook. The pattern’s neckline is $48.1, a close below which would open the way for the move down to continue toward its $44.65 target.
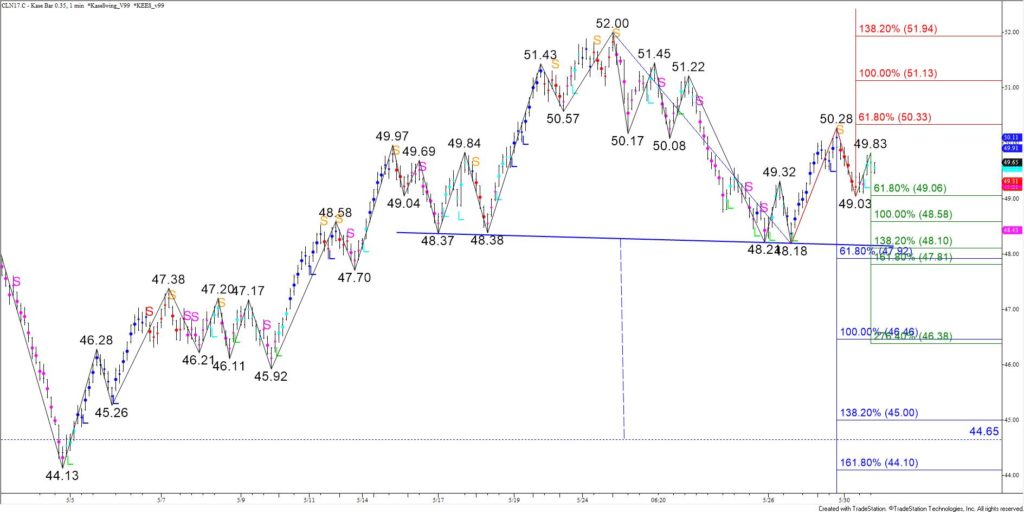
The connection to $48.1 is made through $49.1 and $48.6, the 0.618 and 1.00 projections of the wave $50.28 – 49.03 – 49.83. Tomorrow, we expect prices to test $49.1 and $48.6. A close below the lower objective would call for $48.1, the 1.382 projection, which is also near the 0.618 projection of the larger wave, $52.0 – 48.18 – 50.28.
That said, should prices rise above $50.3, near-term odds would shift in favor of $51.1 and possibly higher. The $50.3 level is the top of the head and shoulder’s right shoulder and the 0.618 projection of the wave $48.18 – 50.28 – 49.03. The 1.00 projection is $51.1. Therefore, a close above $50.3 would significantly damage the head and shoulders formation and the likelihood of a break below its $48.1 neckline.
This is a brief analysis and outlook for the next day or so. Our weekly Crude Oil Commentary and daily updates are much more detailed and thorough energy price forecasts that cover WTI, Brent, RBOB Gasoline, Diesel, and spreads. If you are interested in learning more, please sign up for a complimentary four-week trial.