The overall outlook for WTI crude oil is positive. However, a double top around $71.9, daily spinning top candlestick reversal pattern, and intra-day bearish momentum divergence indicate the pullback from $71.92 should extend to at least $70.4 tomorrow. This target is split between a projection of the wave down from $71.93 and the double top’s $70.26 confirmation point.
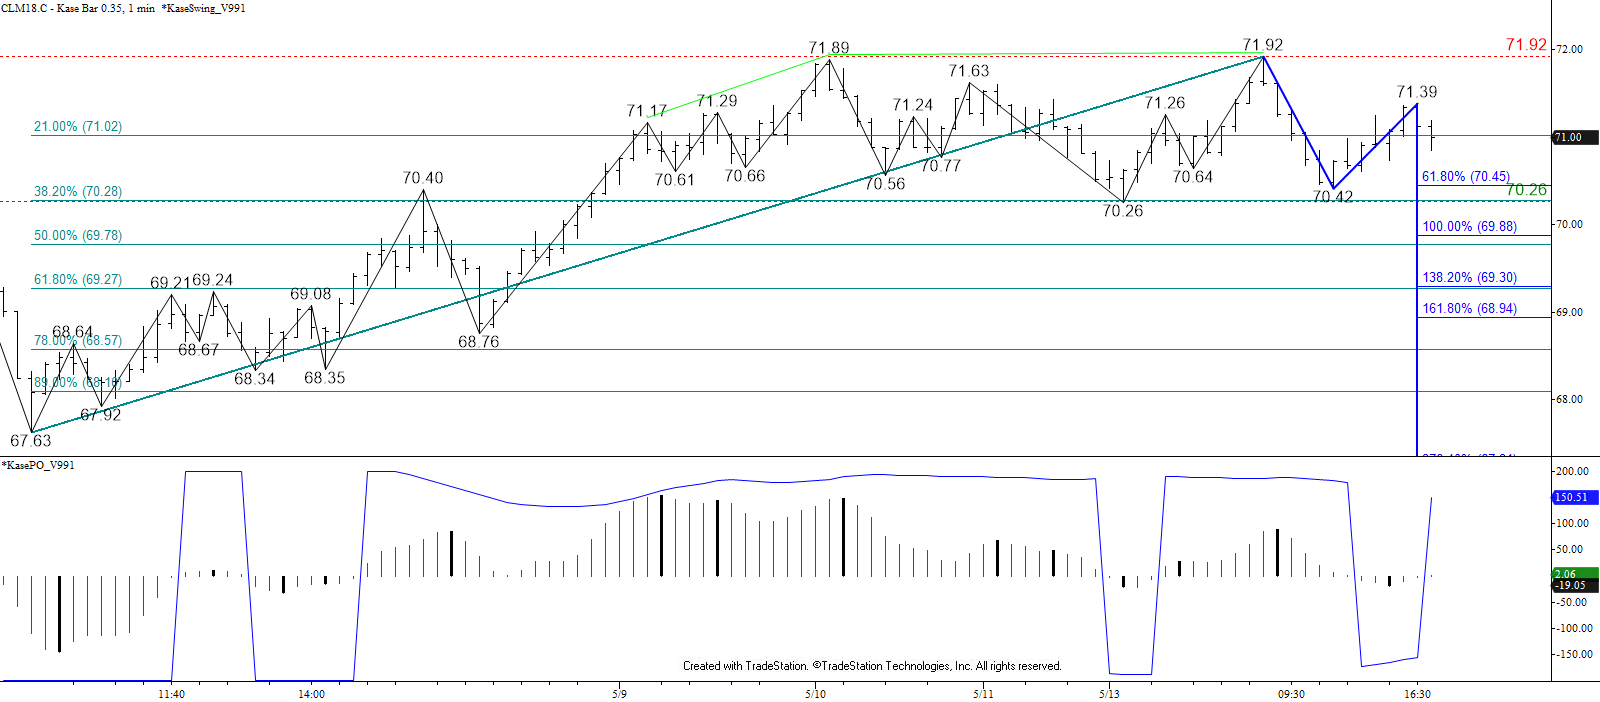
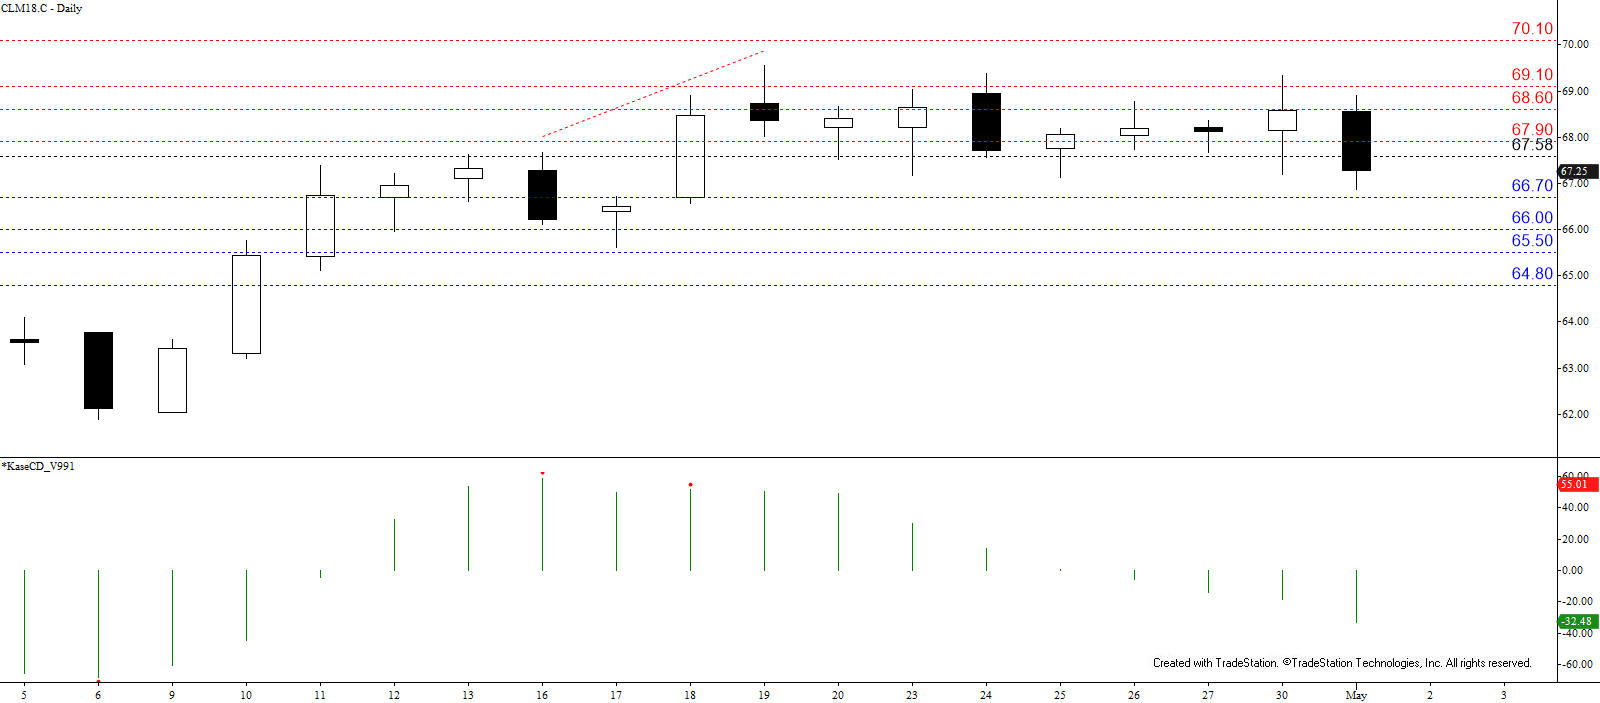
An early move below $70.4 will open the way for $69.9, $69.3, and possibly $68.8. Of these targets, $69.3 is the most likely stalling point because it is near a confluent wave projection and key retracement of the move up from $67.63. Even so, $68.8 has reasonable odds because it is split between the double top’s target and the most important projection of the wave down from $71.92.
Should prices turn higher and overcome $71.4, look for another attempt at $72.0, a close above which would wipe out the double top, spinning top, and bearish divergence signals. This would also open the way for the move up to extend to the next major target at $72.8. This is the most confluent objective as discussed in our weekly Commentary and another likely stalling point for WTI.
This is a brief analysis for the next day or so. Our weekly Crude Oil Forecast and daily updates are much more detailed and thorough energy price forecasts that cover WTI, Brent, RBOB Gasoline, Diesel, and spreads. If you are interested in learning more, please sign up for a complimentary four-week trial.