WTI Crude Oil Technical Analysis and Short-Term Forecast
This is a brief analysis for the next day or so. Our weekly Crude Oil Forecast and daily updates are much more detailed and thorough energy price forecasts that cover WTI, Brent, RBOB Gasoline, Diesel, and spreads. If you are interested in learning more, please sign up for a complimentary four-week trial.
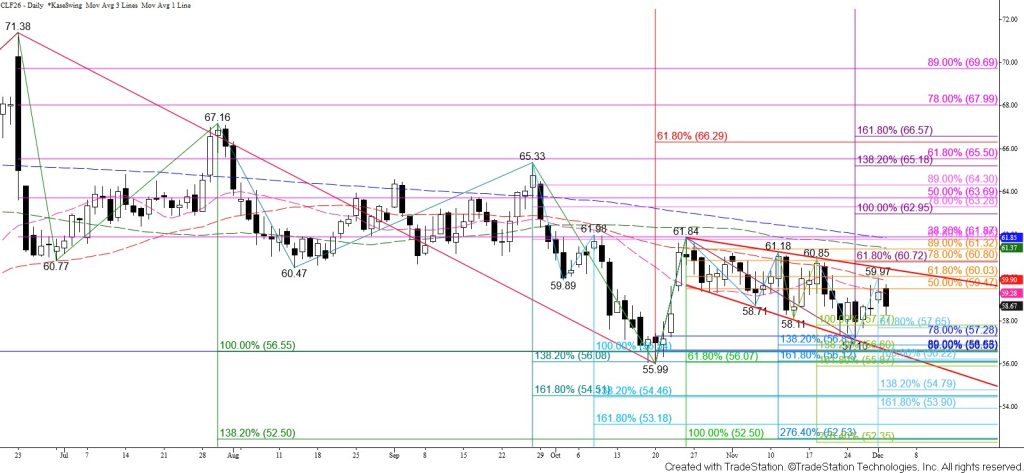
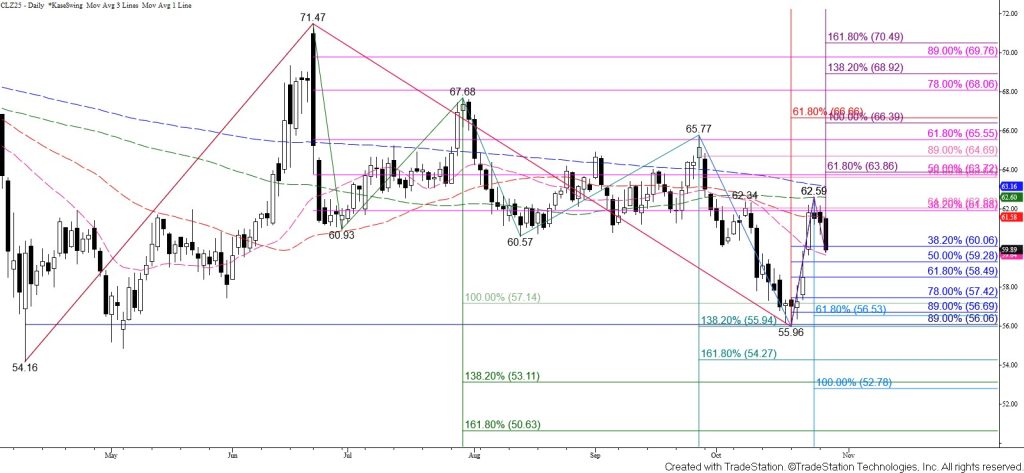
January WTI crude oil failed to test the 62 percent retracement from $61.84 and the 50-day moving average around $60.0 again. The $60.0 level was challenged and held on Monday. Instead, prices fell and formed a daily bearish engulfing line. Today’s engulfing line is not as meaningful as one that forms during an uptrend. However, it suggests that a shortfall within the descending broadening wedge that formed during the decline from $61.84 has occurred. A shortfall is a failure to test the upper or lower trendline of a pattern and typically indicates the pattern will fail. In this case, the wedge may also fail because prices have already retraced more than 62 percent of the rise from $55.99. There is also a complex intraday head and shoulders pattern with a neckline at $58.3. The target of this pattern is $56.6.
A test of at least $58.3 and likely $57.7 will occur tomorrow. The $57.7 target is in line with the equal to (1.00) target of the wave down from $61.18 and the smaller than (0.618) target of the wave down from $60.85. The $57.7 target has been tested a few times, but has held on a closing basis. Closing below $57.7 will provide more evidence that the wedge will fail to break higher and open the way for $57.1 and then a highly confluent and important target at $56.6.
Nevertheless, trading has been erratic for the past few weeks, thus the formation of the wedge. The 50 percent retracement of the rise from $57.1 held on a closing basis today, so there is still a modest chance for another attempt to overcome $60.0 and challenge the upper trendline of the wedge around $60.4. Closing above $60.4 will call for the $60.8 smaller than target of the wave up from $55.99 to be challenged. Settling above $60.7 will confirm a breakout of the wedge because this wave connects to $63.0 as the equal to target.