Gold Technical Analysis and Near-Term Outlook
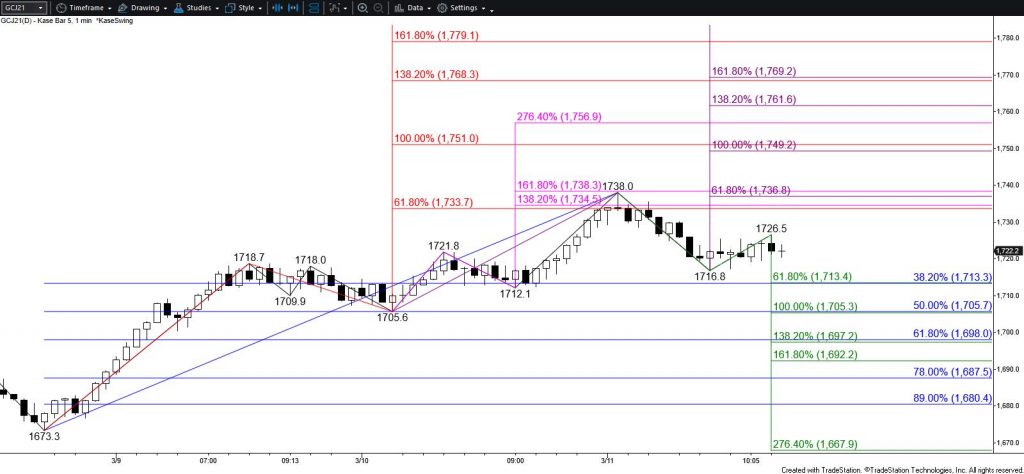
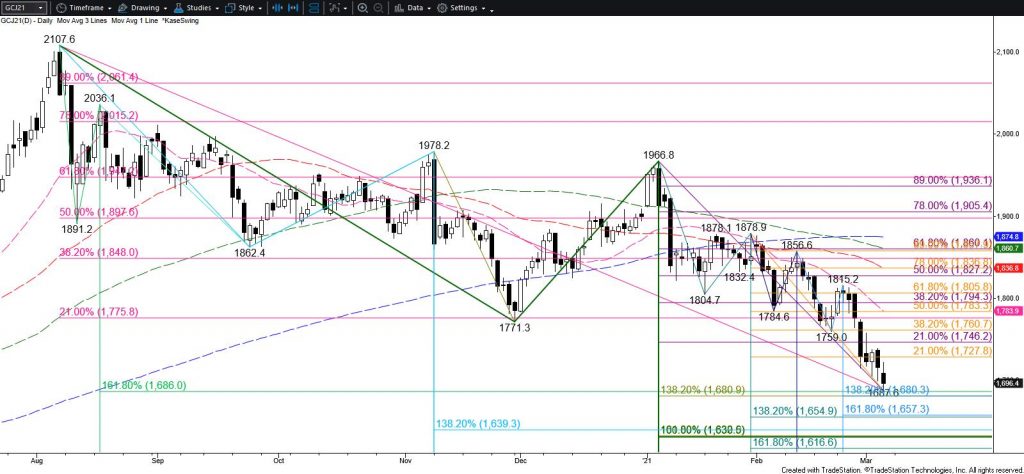
The outlook for gold in the coming weeks remains bearish and the move down is still positioned to eventually challenge $1631. The recent move up from $1673.3 is most likely corrective and is already showing signs that it might be complete. The primary wave up from $1673.3 still favors a test of its $1761 equal to (1.00) target, but today’s decline below the $1722 intra-day swing low dampens those odds. Moreover, today’s move down also settled back below the 20-day moving average and the 50 percent retracement of the decline from $1754.2 has held so far.
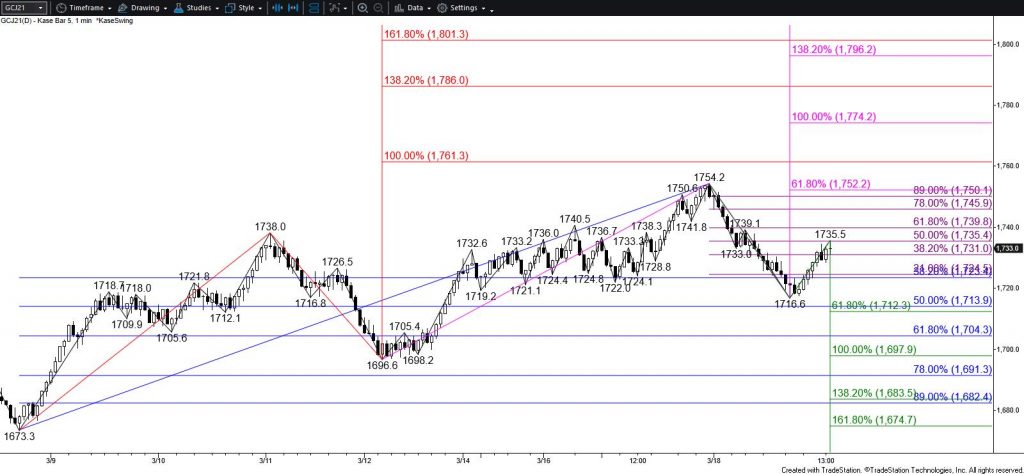
At this point, there is still a reasonable chance for a test of $1761 before the move down continues. However, near-term odds have shifted back in favor of a continued decline. Closing below $1713 will call for $1701, a close below which would imply the corrective move up is complete, clearing the way for $1683 and lower during the next few days.
Conversely, should gold rally again tomorrow and overcome $1749, look for a test of $1761. The $1761 level is expected to hold. Closing above this will call for a more substantial test of resistance with thresholds at $1774 and $1786.
This is a brief analysis for the next day or so. Our weekly Metals Commentary and daily updates are much more detailed and thorough energy price forecasts that cover key COMEX precious metals futures contracts and LME Non-Ferrous (Base) metals, spot gold, the gold/silver ratio, and gold ETFs. If you are interested in learning more, please sign up for a complimentary four-week trial.