Crude Oil Price Forecast – November 10, 2020

WTI Crude Oil Technical Analysis and Short-Term Forecast

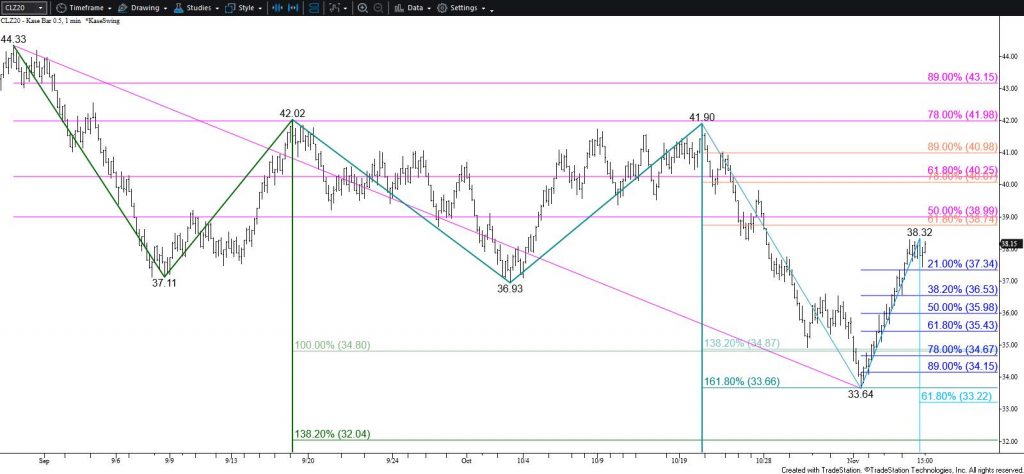
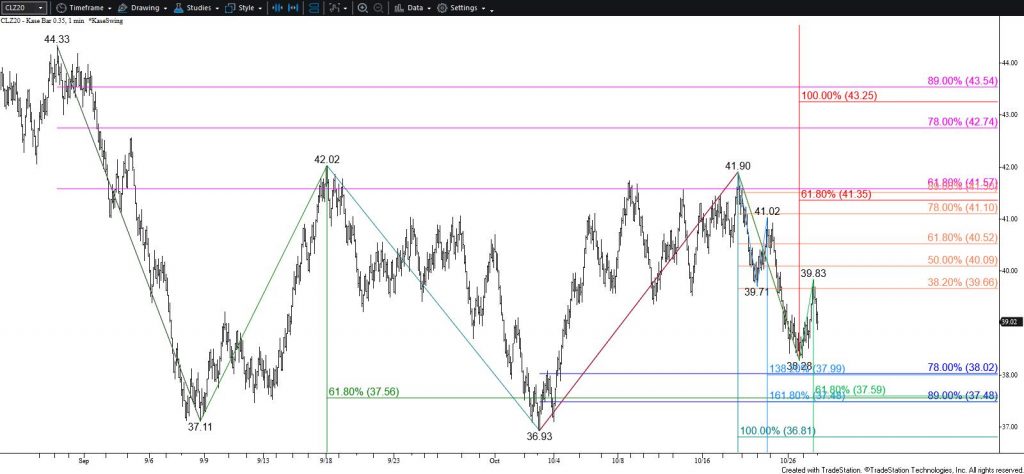
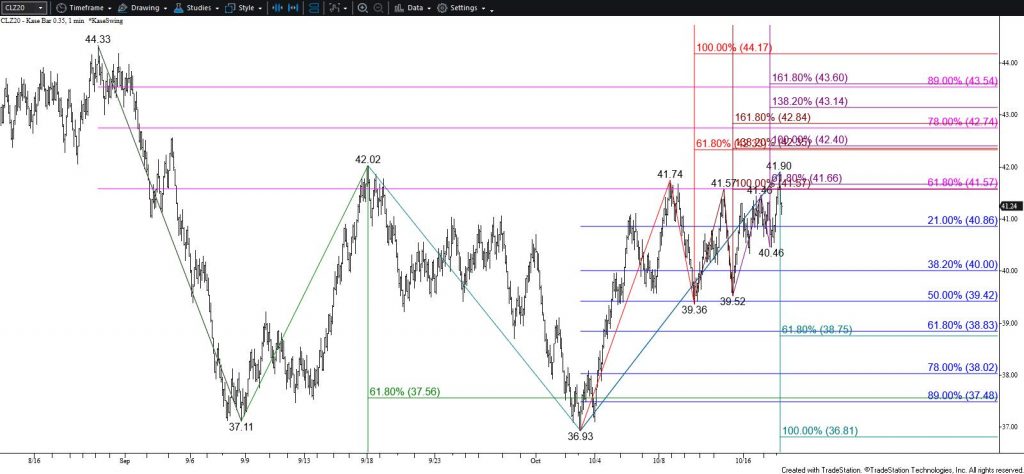
The outlook for WTI crude oil is firmly bullish and the move up is poised to challenge crucial resistance at $42.0. This is a highly confluent wave projection, retracement, and swing high. Overcoming $42.0 will invalidate the primary wave down from $44.33 that had called for $32.0 and lower during the past few weeks. Rising above $42.0 will also confirm a long-term bullish reversal is unfolding, clearing the way for $42.8 and likely $44.9.

WTI Crude Oil - $0.50 Kase Bar Chart
WTI Crude Oil – $0.50 Kase Bar Chart

Nevertheless, when the outlook for WTI has been most positive in recent months the move up has stalled near $42.0 and turned lower to challenge support again. There is no evidence that this will be the case again, but caution is warranted.

Should WTI take out $40.8 before overcoming $42.0 look for a test of $40.0. Support at $40.0 is expected to hold. Key support is $38.8. This is the 62 percent retracement of the rise from $37.06 and the 38 percent retracement from $33.64. Closing below $38.8 would imply that another major test of support is underway before the move up attempts to overcome $42.0 again.

Brent Crude Oil Technical Analysis and Short-Term Forecast

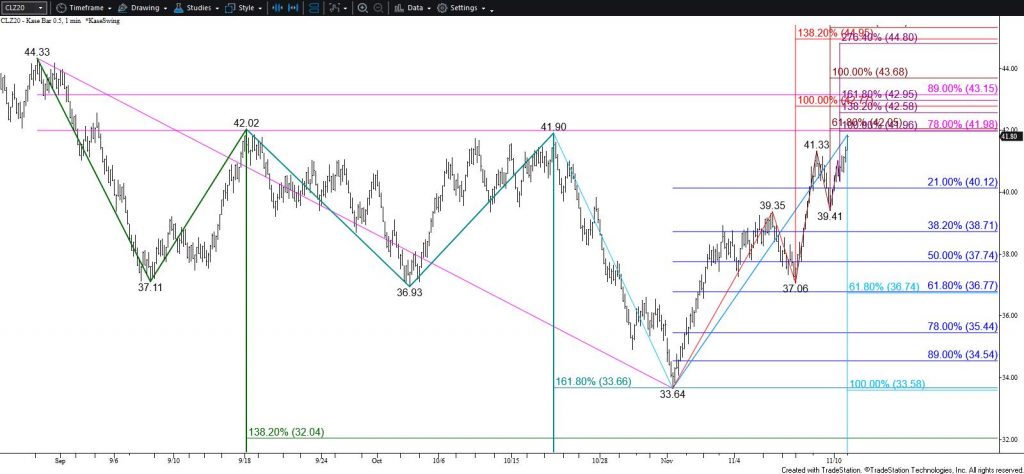
The outlook for Brent is quite bullish after settling above the smaller than (0.618) target of the primary wave up from $36.40 and the 62 percent retracement of the decline from $47.31. This afternoon’s post-settlement rally has overcome the $43.99 swing high and the move up is now poised to test $44.6. This is the last level protecting the $44.67 swing high. Closing above this will clear the way for $45.3 and likely $46.4 during the next few days.

Initial support is $43.1, a move below which will call for $42.4. Support at $42.4 is expected to hold. Key support and the barrier to a bearish near-term outlook is $41.2. Settling below this would shift near-term odds in favor of testing $39.9 and possibly lower before the move up continues.

This is a brief analysis for the next day or so. Our weekly Crude Oil Forecast and daily updates are much more detailed and thorough energy price forecasts that cover WTI, Brent, RBOB Gasoline, Diesel, and spreads. If you are interested in learning more, please sign up for a complimentary four-week trial.

Gold Technical Analysis and Near-Term Outlook

Gold rallied and settled above the 50-day moving average and the 38 percent retracement of the decline from $2089.2. This is bullish for the near-term outlook and reflects a positive shift in near-term sentiment. The move up is now poised to challenge $1963, $1979, and possibly $1999 during the next few days. The $1999 objective is most important because this is the 62 percent retracement and the larger than (1.618) target of the primary wave up from $1851.0.

With that said, the $1948 equal to (1.00) target of the same wave up from $1851.0 held on a closing basis today. Therefore, a test of support might take place before gold challenges $1963. Initial support at $1925 is today’s midpoint and is expected to hold. Key support is $1903, today’s open and the 50 percent retracement of the rise from $1851.0. Closing below $1903 during the next few days will shift odds back in favor of $1873 and lower.

Gold - $15 Kase Bar Chart
Gold – $15 Kase Bar Chart

This is a brief analysis for the next day or so. Our weekly Metals Commentary and daily updates are much more detailed and thorough energy price forecasts that cover key COMEX precious metals futures contracts and LME Non-Ferrous (Base) metals, spot gold, the gold/silver ration, and gold ETFs. If you are interested in learning more, please sign up for a complimentary four-week trial.

Natural Gas Technical Analysis and Near-Term Outlook

Then near-term outlook for natural gas remains bearish and a close below $3.03 will call for another attempt at $2.98 and lower. However, as stated in yesterday’s update, the decline from $3.369 lacks a wave structure that can sustain a larger test of support without testing resistance soon. Today’s bullish hammer, confirmed intra-day bullish divergences, and the wave formation up from $3.002 suggest such a move will probably take place tomorrow.

Rising above $3.09 before taking out $3.03 will call for a test of $3.15. This is a confluent wave projection, the 38 percent retracement of the decline from $3.396, and the hammer’s completion point. Closing above $3.15 is currently doubtful but would call for a more significant test of resistance where $3.25 is the hammer’s confirmation point and the barrier to a renewed bullish outlook.

Natural Gas - $0.01 Kase Bar Chart
Natural Gas – $0.01 Kase Bar Chart

This is a brief analysis for the next day or so. Our weekly Natural Gas Commentary and daily updates are much more detailed and thorough energy price forecasts that cover key natural gas futures contracts, calendar spreads, the UNG ETF, and several electricity contracts. If you are interested in learning more, please sign up for a complimentary four-week trial.

WTI Crude Oil Technical Analysis and Short-Term Forecast

WTI crude oil has adopted a bullish near-term outlook after settling above $37.7, the 38 percent retracement of the decline from $44.33 and the 50 percent retracement from $41.90. This is also last week’s midpoint.

The move up is now poised to challenge a crucial near-term target at $38.8. This is the 50 percent retracement from $44.33 and the 62 percent retracement from $41.90. Closing above $38.8 would put odds in favor of challenging $40.2 and possibly another test of $42.0. The $42.0 objective defined the upper end of the range that December WTI traded in from early September until late last week.

WTI Crude Oil - $0.50 Kase Bar Chart
WTI Crude Oil – $0.50 Kase Bar Chart

That said, the move up from $33.64 lacks a wave structure that can sustain a larger move up. There are no reversal patterns or signals as of this afternoon, but a test of support is anticipated before WTI rises much higher.

Should WTI turn lower early tomorrow look for initial support at $36.5 and then $36.0. Key near-term sport is $35.3. Closing below this will call for another test of $34.8, the equal to (1.00) target of the primary wave down from $44.33, which has held on a closing basis so far.

Brent Crude Oil Technical Analysis and Short-Term Forecast

Brent tested and held $40.0 on a closing basis today. This was near the 38 percent retracement of the decline from $47.31. Even so, the move up is poised to continue because today’s close above last Thursday’s open confirmed Friday’s bullish high wave candlestick reversal pattern. Today’s move up also confirmed daily bullish KaseCD and KasePO divergences. Therefore, odds favor a continued rise to $40.8, a crucial near-term objective that connects to $41.5 and $42.9.

Nevertheless, Brent is due for a test of support before rising much higher. Holding $40.0 suggests such a move might take place early tomorrow. Support at $38.6 is expected to hold and $37.4 is key. Settling below $37.4 would shift near-term odds back in favor of a larger decline.

This is a brief analysis for the next day or so. Our weekly Crude Oil Forecast and daily updates are much more detailed and thorough energy price forecasts that cover WTI, Brent, RBOB Gasoline, Diesel, and spreads. If you are interested in learning more, please sign up for a complimentary four-week trial.

Gold Technical Analysis and Near-Term Outlook

Gold settled below the 100-day moving average for the second straight day and challenged the $1857 target as called for in yesterday’s update. This confluence point is split around the smaller than (0.618) target of the wave down from $1983.8, the 89 percent retracement of the rise from $1851.0, and the intermediate (1.382) and larger than (1.618) targets of the wave down from $1939.4. This may prove to be a temporary stalling point but fulfilling the $1857 objective is bearish for gold’s outlook.

Closing below $1857 will clear the way for $1841 and then the next major objective at $1810. The $1810 objective is the equal to (1.00) target of the primary wave down from $2089.2. Once met, another significant test of resistance is expected before gold falls any lower.

Gold - $15 Kase Bar Chart
Gold – $15 Kase Bar Chart

As stated, due to the confluence of $1857, a test of resistance might take place before falling to $1841 and lower. Resistance at $1893 is expected to hold and $1913 is key for the near-term. Settling above $1913, the smaller than target of the wave up from $1851.0, will shift near-term odds in favor of rising to the $1948 equal to target before the decline continues.This is a brief analysis for the next day or so. Our weekly Metals Commentary and daily updates are much more detailed and thorough energy price forecasts that cover key COMEX precious metals futures contracts and LME Non-Ferrous (Base) metals, spot gold, the gold/silver ration, and gold ETFs. If you are interested in learning more, please sign up for a complimentary four-week trial

Natural Gas Technical Analysis and Near-Term Outlook

The near-term outlook for natural gas leans bullish. However, this is still a tight call because the $3.37/$3.362 double top is still intact and this week’s move up stalled near the equal to (1.00) target of the wave up from $3.159. Also, today’s Harami candlestick is negative and the wave down from $3.336 met its smaller than (0.618) target this afternoon. Therefore, a test of $3.25 and possibly $3.22 is expected before overcoming $3.33. This implies that trading will most likely remain range-bound for another few days before the move up continues.

Natural Gas - $0.035 Kase Bar Chart
Natural Gas – $0.035 Kase Bar Chart

Closing above $3.33 will call for a test of key resistance at $3.37. This is the most confluent target on the chart, a close above which will negate the double top and clear the way for $3.43 and higher.

For natural gas to overcome $3.37 during the next few days, support at $3.22 must hold. Closing below this will take out the smaller than target of the wave down from $3.362, which would call for a test of the $3.13 equal to target. This level is crucial for the near-term because a close below $3.13 will call for $3.09. This is the 62 percent retracement of the rise from $2.922 and the smaller than target of the wave down from $3.37. Settling below $3.09 would clear the way for a test of $3.01 and possibly lower.

This is a brief analysis for the next day or so. Our weekly Natural Gas Commentary and daily updates are much more detailed and thorough energy price forecasts that cover key natural gas futures contracts, calendar spreads, the UNG ETF, and several electricity contracts. If you are interested in learning more, please sign up for a complimentary four-week trial.

WTI Crude Oil Technical Analysis and Short-Term Forecast

The near-term outlook for WTI remains bearish. Although WTI bounced today and settled above yesterday’s midpoint, the move up failed to close above yesterday’s open and held the 38 percent retracement of the decline from $41.9 at $39.7 on a closing basis. Also, the wave formation up from $38.28 stalled just below its larger than (1.618) target and this afternoon’s post-settlement decline has challenged the 62 percent retracement of the rise from $38.28. Finally, yesterday’s close below $38.8, the smaller than (0.618) target of the wave down from $42.02, has put odds in favor of testing the $36.8 equal to (1.00) target. This is in line with the double bottom that formed between the $37.11 and $36.93 swing lows. Therefore, closing below $36.8 will take out the double bottom and clear the way for a much more significant test of support.

WTI Crude Oil - $0.35 Kase Bar Chart
WTI Crude Oil – $0.35 Kase Bar Chart

That said, each time WTI has looked most bearish (or bullish) since early September the move has stalled and WTI has oscillated within the range between nominally $37.0 and $42.0. Also, given today’s close above yesterday’s midpoint, there is an outside chance for a larger test of resistance before WTI falls to challenge $36.8. Closing above $39.7 will call for key resistance at $40.5. This is the 62 percent retracement of the decline from $41.9. Settling above $40.9 will shift near-term odds back in favor of rising to $41.4 and eventually $42.0 where the $42.02 confirmation point of the double bottom would be tested.

Brent Crude Oil Technical Analysis and Short-Term Forecast

The near-term outlook for Brent is bearish after today’s move up held the 38 percent retracement of the decline from $43.57 at $41.5. The post-settlement decline implies that today’s move up is corrective of the recent decline. Tomorrow, look for a test of $40.2, the smaller than (0.618) target of the wave down from $44.3. Settling below this will clear the way for $39.4 and then $38.6.

Resistance at $41.5 should continue to hold. Closing above this will call for a test of key near-term resistance and the 62 percent retracement of the decline from $43.57 at $42.3. Settling above $42.3 is doubtful but would shift odds in favor of $43.2 and higher.

This is a brief analysis for the next day or so. Our weekly Crude Oil Forecast and daily updates are much more detailed and thorough energy price forecasts that cover WTI, Brent, RBOB Gasoline, Diesel, and spreads. If you are interested in learning more, please sign up for a complimentary four-week trial.

Gold Technical Analysis and Near-Term Outlook

Gold continues to trade erratically but retains a bearish outlook. Today’s failure to reach $1942 and the move below $1902, the smaller than (0.618) target of the wave down from $1939.4, has shifted near-term odds back in favor of testing $1882. This objective is key because taking out $1882 will clear the way for the next leg of the move down to challenge $1859, $1840, and eventually $1810.

Gold - $15 Kase Bar Chart
Gold – $15 Kase Bar Chart

Nonetheless, because gold overcame the smaller than targets of the waves up from $1851.0 and $1877.1, there is still a reasonable chance for a test of $1950 before the decline continues.

Should gold settle back above $1925 before taking out $1882 look for a test of $1950. The $1950 level is expected to hold. Closing above this would warn that a bullish reversal is underway and would significantly dampen odds for a continued decline.

This is a brief analysis for the next day or so. Our weekly Metals Commentary and daily updates are much more detailed and thorough energy price forecasts that cover key COMEX precious metals futures contracts and LME Non-Ferrous (Base) metals, spot gold, the gold/silver ration, and gold ETFs. If you are interested in learning more, please sign up for a complimentary four-week trial.

Natural Gas Technical Analysis and Near-Term Outlook

Natural gas overcame $2.96 as called for and challenged the next objective at $3.04. Today’s close well above $2.96 and the psychologically important $3.00 level is bullish for the outlook. This calls for natural gas to challenge at least $3.09 and likely $3.14 during the next few days. The $3.14 objective is a crucial objective for the primary wave up from $2.072. However, $2.96 was in line with the smaller than (0.618) target of the primary wave up from $3.373, and this wave targets $3.20 as its equal to target. Therefore, odds for an eventual move above $3.14 to $3.20 and higher have increased based on the close above $2.96.

Natural Gas - $0.035 Kase Bar Chart
Natural Gas – $0.035 Kase Bar Chart

With that said, the $3.04 target discussed in yesterday’s update is a confluent projection of the subwaves up from $2.373 and $2.610. Also, the move up from 2.638 lacks a clear wave structure that is large enough to support a continued rise. Therefore, a test of support will probably take place soon, and almost certainly before natural gas overcomes $3.14.

Nevertheless, any move down will be corrective of the move up. Should natural gas turn lower early tomorrow look for initial support at $2.96 and key near-term support at $2.90. Settling below $2.90 is doubtful but would clear the way for a more substantial test of support before the move up ultimately continues.

This is a brief analysis for the next day or so. Our weekly Natural Gas Commentary and daily updates are much more detailed and thorough energy price forecasts that cover key natural gas futures contracts, calendar spreads, the UNG ETF, and several electricity contracts. If you are interested in learning more, please sign up for a complimentary four-week trial.

WTI Crude Oil Technical Analysis and Short-Term Forecast

The near-term outlook for WTI crude oil is bullish. For the past few weeks, December WTI has been stuck in a wide range between nominally $37.0 and $42.0 and formed a double bottom around $37.0. Last week, prices oscillated within a smaller range between approximately $39.4 and $41.7. This was in line with the 62 percent retracement of the decline from $44.33 and was just below the $42.02 confirmation point of the double bottom.

Today, December WTI broke higher out of this small recent range but stalled at $41.90. The break higher was bullish for the outlook though, and the move up is poised to reach $42.3 during the next couple of days. This is the most confluent objective on the chart. Setting above $42.3 will establish a bullish uptrend because this will confirm the double bottom, which targets $47.0, and also invalidate the primary wave down from $44.33 that had taken out its $37.6 smaller than (0.618) target a few weeks ago.

WTI Crude Oil - $0.35 Kase Bar Chart
WTI Crude Oil – $0.35 Kase Bar Chart

With that said, the late throwback from $41.90 back into the recent range between $39.4 and $41.7 reflects uncertainty and suggests a test of $40.5 might take place first. Falling below $40.5 will take out a few of the smaller waves that call for $42.3 and higher. This will also call for a test of $40.0. Support at $40.0 is the 38 percent retracement of the rise from $36.93 and is expected to hold. Closing below $40.0 will call for key near-term support at $39.4, a close below which will shift odds in favor of testing $38.8 and possibly lower.

Brent Crude Oil Technical Analysis and Short-Term Forecast

Brent rose a bit higher today but its move up has been more hesitant than WTI’s. Nevertheless, the decline from $43.57 forms a corrective range that should break higher soon. Also, $43.3 was met, so the wave formations now call for a test of $43.8. This then connects to $44.4 and higher.

The $43.3 target was quite important for the near-term outlook, so the throwback from this objective late this afternoon is not surprising. Support at $42.2 is expected to hold and $41.4 is key for the near-term. Settling below $41.4 is doubtful but would reflect a bearish shift in external factors and call for $40.5 and possibly lower in the coming days.

This is a brief analysis for the next day or so. Our weekly Crude Oil Forecast and daily updates are much more detailed and thorough energy price forecasts that cover WTI, Brent, RBOB Gasoline, Diesel, and spreads. If you are interested in learning more, please sign up for a complimentary four-week trial.