Brent Crude Oil Price Forecast – April 15, 2025

Brent Crude Oil Technical Analysis and Short-Term Forecast

This is a brief analysis for the next day or so. Our weekly Crude Oil Forecast and daily updates are much more detailed and thorough energy price forecasts that cover WTI, Brent, RBOB Gasoline, Diesel, and spreads. If you are interested in learning more, please sign up for a complimentary four-week trial.

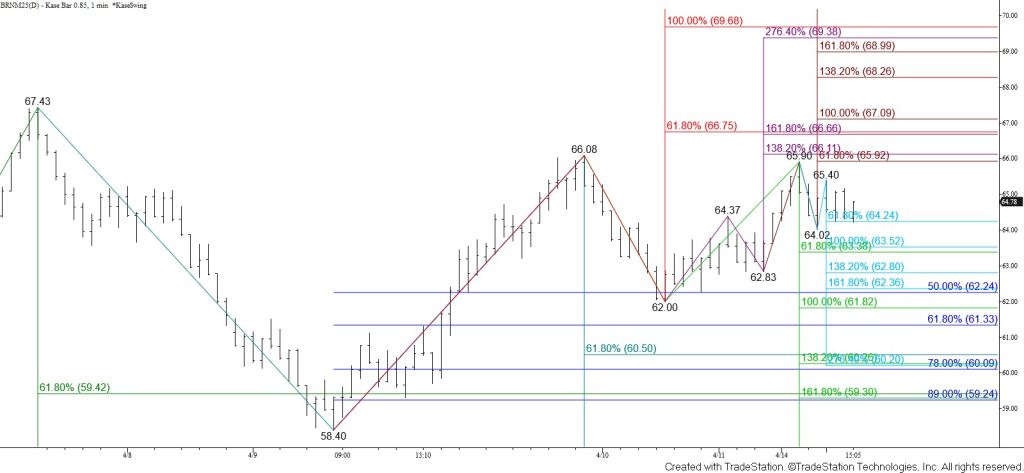
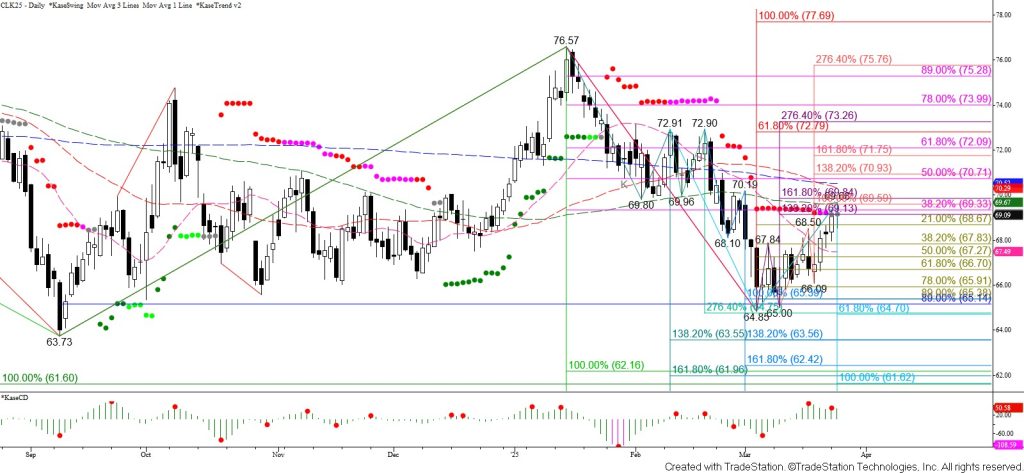
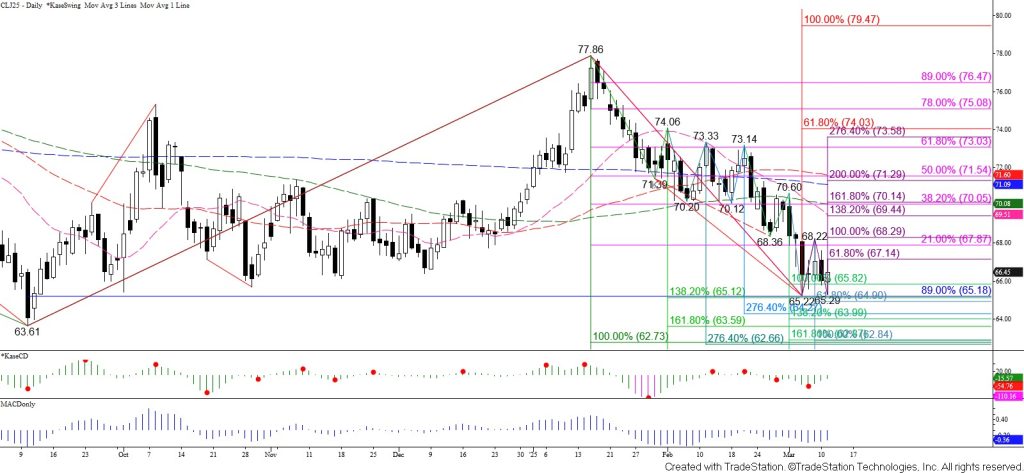
Brent crude oil formed another daily doji. So far, trading this week has reflected uncertainty, suggesting that traders are awaiting further information. The near-term outlook leans bullish because the waves up from $62.0 call for a test of $66.0, a close above which will clear the way for the $66.8 smaller than (0.618) target of the wave up from $58.4 to be challenged. Settling above $66.8 will confirm a bullish outlook for the coming days and open the way for a push to fulfill the $69.7 equal to (1.00) target of the wave up from $58.4. The connection to $69.7 is made through targets at $68.3 and $69.2.

Nonetheless, there is some evidence that suggests another test of support might occur first. The wave down from $65.9 fulfilled its $64.2 smaller than target today. This wave connects to $63.5 as the equal to target, which is also in line with the smaller than target of the wave down from $66.08. Falling below $62.8 would call for a test of key support and this wave’s $61.8 equal to target. This objective is key because falling to $61.8 would take out the $62.0 swing low and invalidate the wave up from $58.4 which projects to $66.8 and higher.

Natural Gas Technical Analysis and Near-Term Outlook

This is a brief analysis for the next day or so. Our weekly Natural Gas Commentary and daily updates are much more detailed and thorough energy price forecasts that cover key natural gas futures contracts, calendar spreads, the UNG ETF, and several electricity contracts. If you are interested in learning more, please sign up for a complimentary four-week trial.

May natural gas initially fell below the crucial $3.40 equal to (1.00) target of the primary wave down from $4.946. The move down stalled at $3.336, which was just above the $3.31 larger than (1.618) target of the wave down from $4.322 and the XC (2.764) projection of the wave down from $4.253. The subsequent move up recaptured the 100-day moving average, settled above Tuesday’s open, and confirmed daily bullish MACD and Stochastic divergences. Therefore, a bullish reversal might be underway.

The intra-day wave formation up from $3.336 calls for a test of $3.89. This is the highest that the first wave up from $3.336 projects and is in line with the 62 percent retracement of the decline from $4.253. Overcoming this will call for the 38 percent retracement of the decline from $4.946 at $3.95 to be tested. Settling above $3.95 will imply that the move up is more than just a simple correction, clearing the way for $4.05 and possibly $4.15 to be challenged in the coming days.

Nevertheless, Monday’s open held on a closing basis and the wave formation up from $3.336 is due for a correction before overcoming $3.89. Should prices turn lower early tomorrow look for initial support at $3.64 and then $3.52. The $3.52 level is expected to hold. Falling below this would call for another attempt to settle below key support at $3.40.

WTI Crude Oil Technical Analysis and Short-Term Forecast

This is a brief analysis for the next day or so. Our weekly Crude Oil Forecast and daily updates are much more detailed and thorough energy price forecasts that cover WTI, Brent, RBOB Gasoline, Diesel, and spreads. If you are interested in learning more, please sign up for a complimentary four-week trial.

WTI crude oil shook off Monday’s long-legged doji and is continuing to work its way lower after settling below the equal to (1.00) target of the waves down from the $79.52 May contract high and the $76.57 swing high. The intra-day wave down from $63.90 took out its $59.3 smaller than (0.618) target late this afternoon and is poised to reach at least the $57.7 equal to target tomorrow. This wave makes a connection to $56.1 as the intermediate (1.382) target. This is also the intermediate target of the largest wave down from $76.57. As prices fall toward $56.1 look for the $56.7 intermediate target of the wave down from $78.14 to be fulfilled. Settling below $56.1 will clear the way for the $55.5 larger than (1.618) target of the wave down from $63.90 and the intermediate target of the wave down from $79.52 to be fulfilled.

Today’s decline negated Monday’s long-legged doji, so there are no bullish patterns that call for the move down to stall. Even so, the daily KasePO, KaseCD, RSI, and Stochastic are oversold. The oversold momentum oscillators warn that a test of resistance might occur soon. Any move up will likely be a correction though as the wave formation is now poised to reach the targets in the mid-$50s. Initial resistance is $60.3 and key near-term resistance is $61.2. Settling above $61.2 would shift the near-term odds in favor of a solid correction before the move down extends to fulfill the targets in the mid-$50s as expected.

Natural Gas Technical Analysis and Near-Term Outlook

May natural gas broke through support at $4.05 late last week and has continued to grind its way lower for the past few days. Prices are struggling to close below the 50-day moving average at $3.85. Even so, the wave formation calls for a test of the $3.76 smaller than (0.618) target of the primary wave down from $4.946. This is also the 50 percent retracement of the rise from $2.595. The $3.76 target is a decision point. Settling below $3.76 will open the way for the eventual fulfillment of this wave’s $3.40 equal to (1.00) target, with a test of the crucial 62 percent retracement at $3.49 along the way.

Daily momentum is working it was lower too and the 10-day DMI had a bearish crossover on Tuesday. The ADX is below 25 and declining though, so there is currently not a trend reflected by these indicators on the daily chart. There are no bullish patterns or signals that call for the move down to stall before reaching $3.76, but support around the 50-day moving average has been resilient for the past two days. Should May natural gas rally and overcome $3.96 look for a test of $4.02 and possibly key near-term resistance at $4.07.

WTI Crude Oil Technical Analysis and Short-Term Forecast

This is a brief analysis for the next day or so. Our weekly Crude Oil Forecast and daily updates are much more detailed and thorough energy price forecasts that cover WTI, Brent, RBOB Gasoline, Diesel, and spreads. If you are interested in learning more, please sign up for a complimentary four-week trial.

May WTI crude oil held resistance at $69.7 and settled below the crucial $69.2 level again. The $69.2 threshold is a decision point for WTI crude oil because it is in line with the intermediate (1.382) target of the wave up from $64.85, the 38 percent retracement of the decline from $76.57, and the bullish threshold for the daily Kase Trend indicator.

A normal correction of the decline from $76.57 should continue to hold $69.2 on a closing basis. Today’s long-legged doji and daily bearish KaseCD divergence setup indicate this may be the case. To confirm the bearish momentum divergence, today’s $69.68 high must hold and WTI crude oil must fall below today’s $68.52 low. The smaller than (0.618) target of the intra-day wave down from $69.68 is $69.4. Falling below this will call for $67.9, a close below which will confirm the long-legged doji and take out the 38 percent retracement of the rise from $64.85. Such a move would open the way for tests of $67.3 and $66.7 in the coming days. Settling below $66.7 will imply that the corrective move up from $64.85 is complete.

Nevertheless, this is a very tight call for tomorrow. Closing above the $69.8 larger than (1.618) target of the wave up from $64.85 will confirm bullish sentiment and open the way for tests of the 50- and 200-day moving averages at $70.4, thus overcoming the $70.19 swing high. In this scenario there is also a good chance for a test of $70.8 and eventually a key resistance level at $71.9, which is in line with the 62 percent retracement of the decline from $76.57. Settling above $71.9 will imply that the move down from $76.57 is complete and that WTI crude oil has adopted a bullish outlook for the coming weeks.

Natural Gas Technical Analysis and Near-Term Outlook

This is a brief analysis for the next day or so. Our weekly Natural Gas Commentary and daily updates are much more detailed and thorough energy price forecasts that cover key natural gas futures contracts, calendar spreads, the UNG ETF, and several electricity contracts. If you are interested in learning more, please sign up for a complimentary four-week trial.

April natural gas rose today after holding the 38 percent retracement of the rise from $2.501 at $3.98 for four straight days. A triple bottom formed around $3.96 and was confirmed by today’s close above the $4.218 swing high. Prices also settled above the 21 percent retracement of the decline from $4.901 and the 20-day moving average.

The move up might still prove to be a correction of the decline from $4.901 but is poised to extend to at least $4.34 tomorrow. Closing above this will call for $4.42, a test of the $4.50 target of the triple bottom, and possibly another attempt to settle above a key target at $4.56 on both the April and continuation charts.

Prices are pulling back from the $4.259 swing high late this afternoon so a test of the 38 percent retracement of the rise from $3.955 at $4.14 might occur first. Settling below this will warn that the move up is failing and call for a test of the 62 percent retracement at $4.07. Closing below $4.07 will imply that the move up from $3.955 is complete. However, at this point, April natural gas must settle below $3.98 to put the odds firmly back in favor of a deeper test of support.

Gasoline Technical Analysis and Short-Term Forecast

This is a brief analysis for the next day or so. Our weekly Crude Oil Forecast and daily updates are much more detailed and thorough energy price forecasts that cover WTI, Brent, RBOB Gasoline, Diesel, and spreads. If you are interested in learning more, please sign up for a complimentary four-week trial.

Gasoline rose to test and hold the 38 percent retracement of the decline from $2.4072 at $2.199 on a closing basis today. The subsequent move down from $2.2068 helped to form a daily shooting star. This implies that the corrective move up from $2.0702 is probably complete.

Moreover, today’s test of $2.199 likely completed Wave IV of a five-wave trend down from $2.4072. A test of at least $2.155 and possibly $2.140 is favored for tomorrow. The key target for the coming days is $2.121, the 62 percent retracement of the rise from $2.0702 and equal to (1.00) target of the wave down from $2.2068. Settling below this will provide more evidence that the corrective Wave IV is complete and that Wave V is underway.

That said, should gasoline settle above $2.199 the validity of the five-wave count will be called into question. Settling above $2.199 will also warn that the move down is failing and call for a much more substantial test of resistance where the next major threshold is the 50 percent retracement from $2.4072 and 200-day moving average at $2.239.

Gold Technical Analysis and Near-Term Outlook

This is a brief analysis for the next day or so. Our weekly Metals Commentary and daily updates are much more detailed and thorough energy price forecasts that cover key COMEX precious metals futures contracts and LME Non-Ferrous (Base) metals, spot gold, the gold/silver ratio, and gold ETFs. If you are interested in learning more, please sign up for a complimentary four-week trial.

Gold rose to a new high and settled just below the psychologically important $3000 level. The wave up $2844.1 is now poised to test at least the $3017 intermediate (1.382) target and likely the $3043 larger than (1.618) target within the next few days. The $3043 objective is also the XC (2.764) projection of the wave up from $2882.5 and is an important projection for the larger-scale waves up from $2107.8 and $2392.4. Given that $3043 is the most confluent and important target on the chart, it is a potential stalling point.

There are no daily bearish patterns or signals that call for a reversal. However, the KasePO is overbought on the $10 Kase Bar chart. The KaseCD is also set up for a bearish divergence on this chart. Any move down will likely be a simple correction and should hold today’s $2967 midpoint. Today’s $2943 open is key near-term support.

Natural Gas Technical Analysis and Near-Term Outlook

This is a brief analysis for the next day or so. Our weekly Natural Gas Commentary and daily updates are much more detailed and thorough energy price forecasts that cover key natural gas futures contracts, calendar spreads, the UNG ETF, and several electricity contracts. If you are interested in learning more, please sign up for a complimentary four-week trial.

The outlook for natural gas is bearish after the move down accelerated and confirmed Monday’s shooting star and Tuesday’s long-legged doji. The pullback from $4.901 also fell below the $4.132 swing low, took out the 20-day moving average, and confirmed daily bearish KasePO, KaseCD, RSI, and Stochastic divergences. These confirmed bearish patterns and signals call for a more substantial test of support in the coming days and warn that a bearish reversal might be underway.

Tomorrow, look for a test of the 38 percent retracement of the rise from $2.501 at $3.98. Settling below this will provide further evidence that the move down is more than a simple correction. This will also clear the way for projections of the wave formation down from $4.901 at $3.92 and $3.80. The next major target below $3.98 is the 50 percent retracement at $3.70. Falling to $3.70 will take out the last major swing low at $3.742.

There are no bullish patterns or signals that call for the move down to stall before reaching at least $3.98. Even so, should prices rally again and overcome today’s $4.23 midpoint, look for a test of key near-term resistance at $4.37. Settling above $4.37 will warn that the move down is failing and call for a push to challenge $4.49 and possibly a major threshold at $4.57 on both the April and continuation charts again.

WTI Crude Oil Technical Analysis and Short-Term Forecast

This is a brief analysis for the next day or so. Our weekly Crude Oil Forecast and daily updates are much more detailed and thorough energy price forecasts that cover WTI, Brent, RBOB Gasoline, Diesel, and spreads. If you are interested in learning more, please sign up for a complimentary four-week trial.

WTI crude oil is struggling to take out the $65.22 swing low. A double bottom around $65.25 formed. This pattern’s confirmation point is the $68.22 swing high. The daily bullish KaseCD and MACD divergences confirmed at the $65.22 swing low are intact, and the wave up from $65.22 fulfilled its $65.1 smaller than (0.618) target. This wave connects to $68.3 as the equal to (1.00) target. Given these factors, the near-term outlook leans bullish. Closing above $68.2 will open the way for a more substantial correction and potentially a bullish reversal because the double bottom’s target is $71.3

That said, a larger move up from $65.22 will likely be a correction because the wave formation still favors an eventual test of $62.7. Furthermore, the wave down from $68.22 warns that the double bottom will fail, making this a tight call for tomorrow. Taking out the $65.4 smaller than target of this wave will call for a move below the double bottom to fulfill this wave’s $64.8 equal to (1.00) target. Settling below $64.8 will confirm a bearish outlook for the coming days.