Read on TraderPlanet.com
After last year’s viral outbreak that killed millions of hogs, pork production, now having recovered, looks to set records and overshoot demand. Apparently some commodity advisors are panicking and recommending that their producer clients use lean hog futures to hedge and avoid even lower prices. Is this a good idea?
To our view, hedging hogs today would be like closing the sty door after the pig has fled. In Kase’s energy practice, producers hedge when markets are enjoying high prices, not when already painfully low. At this point, defensive measures are called for.
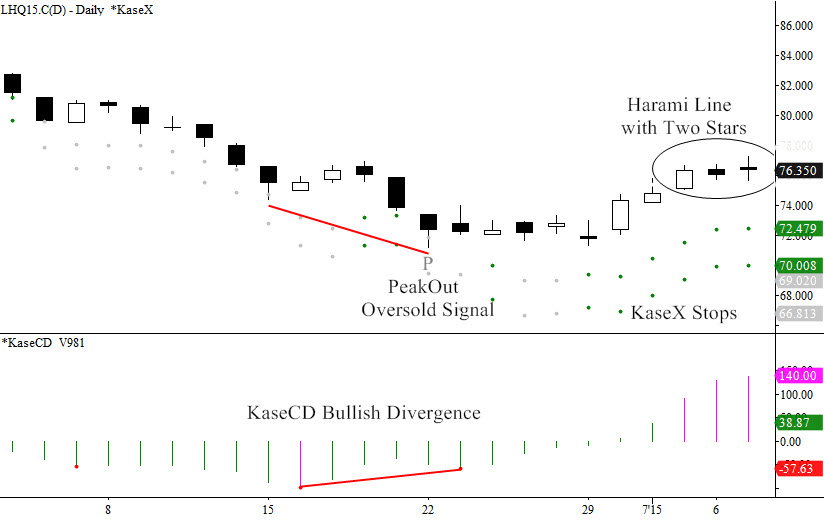
The reason I’d be a reluctant outright seller or short hedger is that prices have been rising over the past few weeks, not falling. Looking at the August 2015 contract, prices fell from a 95.35 high last November to a 71.175 low June 22. Then the KasePO and KaseCD momentum indicators generated bullish oversold and momentum divergence signals. A 71.275 swing low followed, forming a classic “W” shape, or double bottom.

Last week’s candlestick completed a classic bullish morning star. However, the pattern remains unconfirmed until a close over 76.65, dampening the bullish tone. Also, the daily chart shows a potentially negative Harami line with two stars.
While the overall structure is down, the current 6 cent bounce could continue to 79 and maybe 81.5. A close over 81.5 hasn’t high odds right now, but if it happens we could see another 10 cents. 79 is the 2*1.38 extension and Phi2 corrective projection for 71.175 – 74.05 – 71.275. For the final wave up spanning from July 2 to July 7, 75.175 – 77.275 – 75.625, 79 is the 1.62 extension and 81.5 is both the trend terminus (77.2753/75.1752), and 2*1.38 extension.
If there isn’t a close over 76.65 soon, the rally might fail. A close below June 2s open, 75.15, followed by 72.4 would be cause for concern. A close below 70 could send lean hog prices squealing – potentially to 55 cents as, from a technical standpoint, targets ranging from 67 down to 55 have similar odds.
72.4 and 70 are KaseX stops. The key wave, 95.35 – 86.00 – 90.65, targets 70 as the important 1.62 extension. The last down wave, 77.275 – 75.625 – 76.625 targets 72.4 as the trend terminus (77.2753/75.6252), 2*1.38 extension and Phi3 corrective projection.
Here’s my hedging strategy. If you’re ok with “getting called”, sell calls above the market, maybe just above 81.5, perhaps purchasing puts on the downside with the funds depending on your risk appetite and whether you need to qualify for hedge accounting. Otherwise wait for a drop below 75.15 or so, then scale-in short calls maybe five cents or so above the market, again possibly buying puts. Meanwhile, grab a beer and a brat and watch the thresholds.
Send questions for next week to askkase@kaseco.com, and for energy hedging visit the Kase Energy Hedging Services page.
Charts created using TradeStation. ©TradeStation Technologies, Inc. 2001-2015. All rights reserved. No investment or trading advice, recommendation or opinions are being given or intended.


