Natural Gas Technical Analysis and Near-Term Outlook
This is a brief analysis for the next day or so. Our weekly Natural Gas Commentary and daily updates are much more detailed and thorough energy price forecasts that cover key natural gas futures contracts, calendar spreads, the UNG ETF, and several electricity contracts. If you are interested in learning more, please sign up for a complimentary four-week trial.
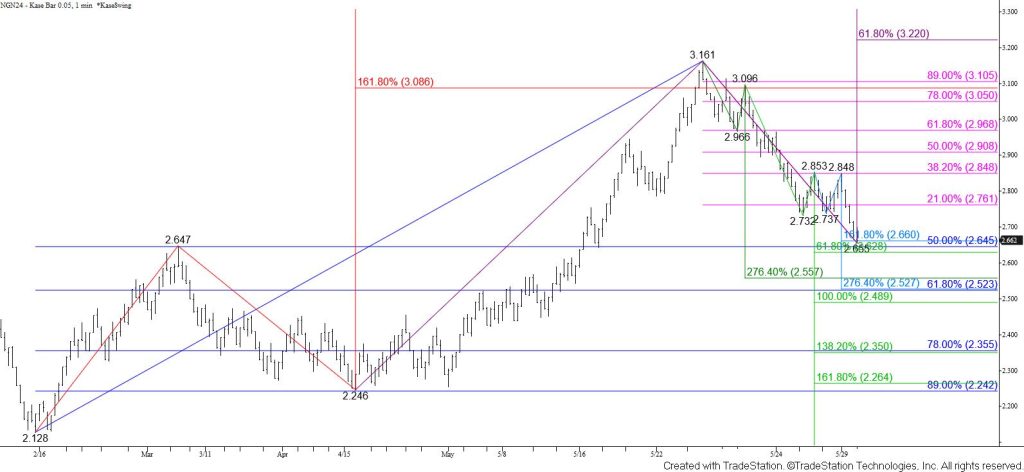
July natural gas’ move down from $3.161 accelerated again today and settled below the 38 percent retracement of the rise from $2.128. This implies that the move down is more than just a simple profit-taking correction. A more significant test of support is now favored.
Tomorrow, look for a test of the 50 percent retracement and a confluent wave projection target around $2.64. Settling below this will call for a test of the $2.56 XC (2.764) projection of the largest wave down from $3.161. This is a potential stalling point. However, the waves down from $3.096 and $2.853 suggest that upon a close below $2.64 the move down could challenge $2.52 and $2.49 in the coming days. Settling below $2.52, which is also the 62 percent retracement of the rise from $2.128, is doubtful but would reflect a bearish shift in sentiment for the coming weeks.
The significance of the move down from $3.161 during the past few days suggests that the move up was overextended. There is little doubt that a long-term bottom has been made, so it now looks as though natural gas is looking to settle into a new trading range. Based on historical evidence, this range will most likely be between $2.50 and $3.00.


