Gold Price Forecast
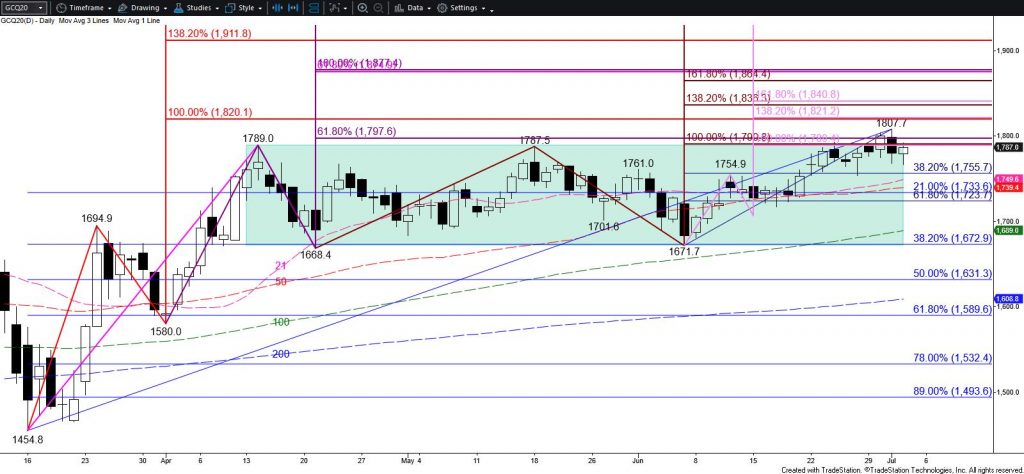
Gold closed above $1790 on June 30. This was bullish for the long-term outlook because $1790 is the upper threshold of a rectangle pattern that prices have been trading in since mid-April. Based on the wave formations, the move up should extend to at least $1820 and likely much higher in the coming weeks and possibly months. Nevertheless, yesterday’s close back below $1790 dampens near-term odds for a continued rise.
Today’s small move up was somewhat encouraging for gold bulls in that it overcame an intra-day swing high of $1785.5. This negated a wave down from $1807.7 that called for a deeper test of support. Tomorrow, look for a test of $1800, a close above which will substantially increase odds for a move to $1820 early next week.

Nevertheless, yesterday’s move down confirmed a bearish Slow Stochastic divergence and today’s move up held the 62 percent retracement of the decline from $1807.7. Therefore, there is still a reasonable chance for a deeper test of support before the move up continues. Falling below $1766 will call for $1753, which is expected to hold. Key near-term support is $1753. Settling the week below this would call for $1738 and possibly $1724. Taking out $1724 would imply that the close above $1790 was a false break higher out of the rectangle. This is doubtful but would suggest the move up is failing.
This is a brief analysis for the next day or so. Our weekly Metals Commentary and daily updates are much more detailed and thorough energy price forecasts that cover key COMEX precious metals futures contracts and LME Non-Ferrous (Base) metals, spot gold, the gold/silver ration, and gold ETFs. If you are interested in learning more, please sign up for a complimentary four-week trial.


