Gold Price Forecast
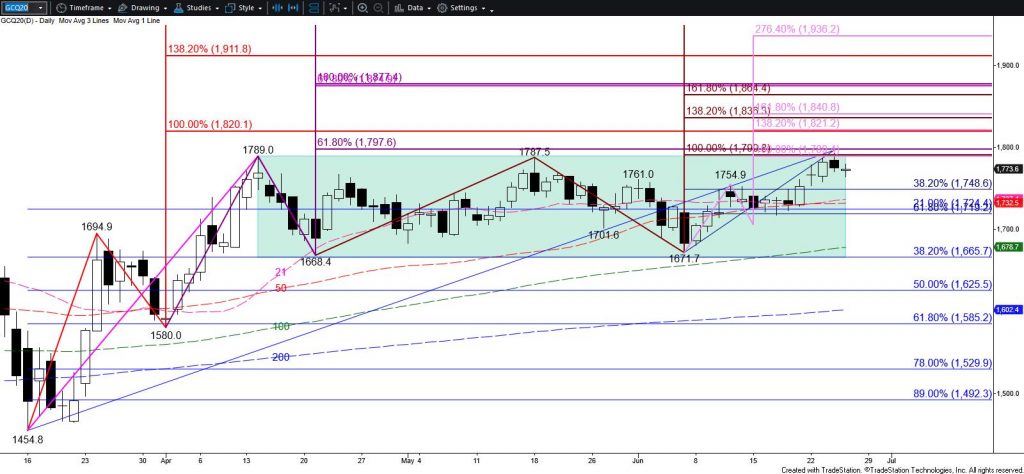
Since mid-April, gold futures have traded in a sideways range that formed a rectangle pattern between nominally $1670 and $1790. The upper threshold of the pattern was briefly overcome on Wednesday, but $1790 held on a closing basis. Even so, odds favor a break higher out of the pattern. A close above $1790 will call for $1820 and eventually a move to the rectangle’s $1910 target ($1789 + ($1789 – $1668.4) = $1909.6).

Nevertheless, the $1790 threshold is also a confluent projection for the waves up from $1668.4 and $1671.7. Therefore, a test of $1750 support might take place first. Closing below $1750 will call for key near-term support at $1723. Any move down will likely be corrective and should result in a short fall (a failed test of the rectangle’s bottom). Even so, should gold close below $1723 look for another oscillation within the rectangle before a breakout of the pattern occurs.
This is a brief analysis for the next day or so. Our weekly Metals Commentary and daily updates are much more detailed and thorough energy price forecasts that cover key COMEX precious metals futures contracts and LME Non-Ferrous (Base) metals, spot gold, the gold/silver ration, and gold ETFs. If you are interested in learning more, please sign up for a complimentary four-week trial


