Natural Gas Price Forecast
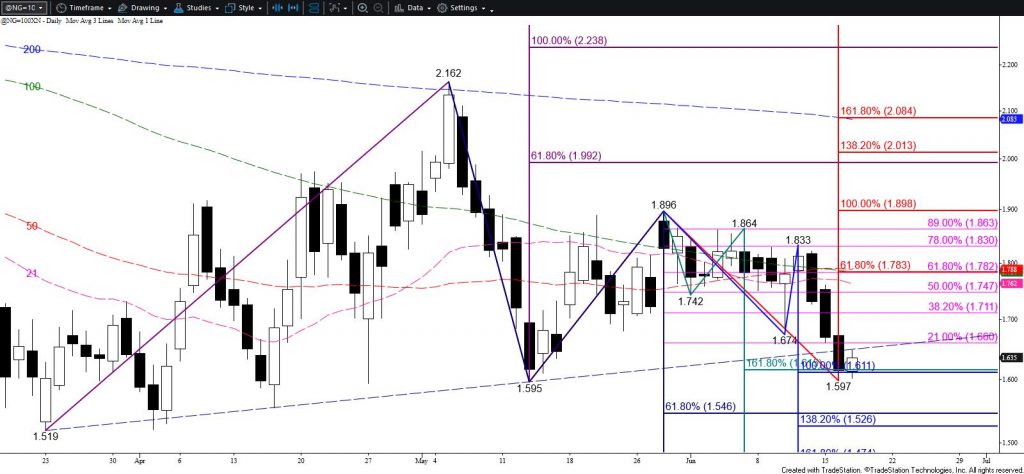
The outlook for natural gas is bearish after settling below $1.69 and wiping out the bullish hammer that formed a week ago on June 10. The move down also broke the lower trend line on the continuation chart connecting the $1.519 and $1.595 swing lows. Today’s pullback tested and held this same trend line and Tuesday’s midpoint, which is bearish for the near-term. Finally, the move up from $1.597 forms a bearish flag that is poised to break lower.

A close below $1.60 is expected during the next day or so and will open the way for $1.54 and likely $1.49. Once $1.49 is met, another significant test of resistance is anticipated.
Nevertheless, $1.60 is a historically important level and has been resilient support after prompt month prices on the continuation chart fell to $1.519 on March 23. So far, $1.60 hast held on a closing basis. Should the corrective move up from $1.597 extend above $1.67 first, look for a test of $1.71. Resistance at $1.71 is expected to hold, though a close above this will call for $1.78. This is key resistance because settling above $1.78 will open the way for a move to, and likely above, $1.83. For now, such a move is doubtful without a strong bullish shift in external factors (e.g. weather or other demand).
This is a brief analysis for the next day or so. Our weekly Natural Gas Commentary and daily updates are much more detailed and thorough energy price forecasts that cover key natural gas futures contracts, calendar spreads, the UNG ETF, and several electricity contracts. If you are interested in learning more, please sign up for a complimentary four-week trial.


