Gold Price Forecast
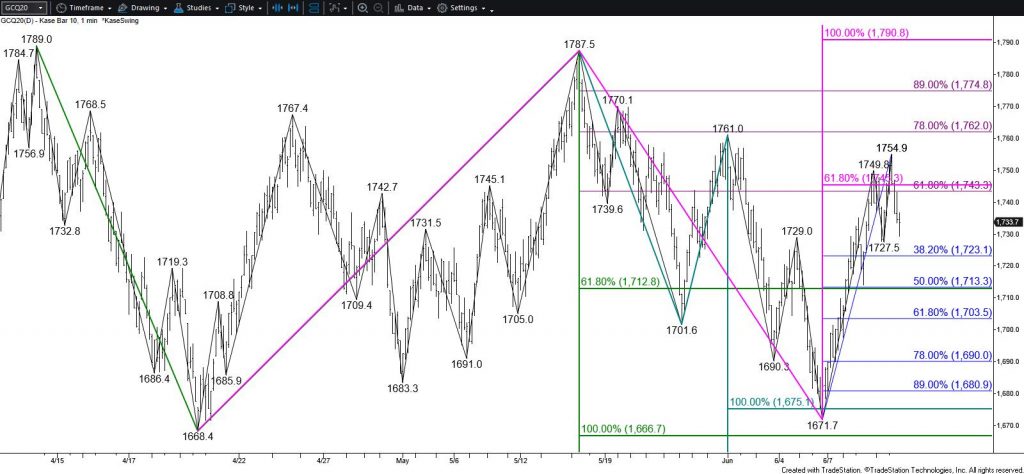
Gold is trading in a range between nominally $1670 and $1790. This is bullish for the long-term outlook as the range forms a rectangle top, a pattern that breaks higher around 63 percent of the time. The pattern also reflects the significance of $1665 support and $1790 resistance and sets gold up for a breakout trade in either direction. Both $1665 and $1790 are highly confluent wave projections, and in the case of $1665, retracements, too.

The move above $1744, the smaller than (0.618) target of the wave up from $1668.4 and the 62 percent retracement of the decline from $1787.5, during the last few days was positive and suggests gold should challenge $1790 again soon. This is the equal to (1.00) target of the wave up from $1668.4. Closing above $1790 will confirm a break higher out of the rectangle pattern, clearing the way for $1815 and higher.
Nevertheless, the recent move up looks a bit overextended on the intra-day charts and has not been able to close above $1744. Therefore, a test of $1723 and possibly $1698 will likely take place first. Support at $1698 is expected to hold. Closing the week below this will call for $1665, which is in line with the bottom of the rectangle. Closing below $1665 would confirm a break lower out of the pattern and clear the way for a much more substantial move down.
This is a brief analysis for the next day or so. Our weekly Metals Commentary and daily updates are much more detailed and thorough energy price forecasts that cover key COMEX precious metals futures contracts and LME Non-Ferrous (Base) metals, spot gold, the gold/silver ration, and gold ETFs. If you are interested in learning more, please sign up for a complimentary four-week trial.


