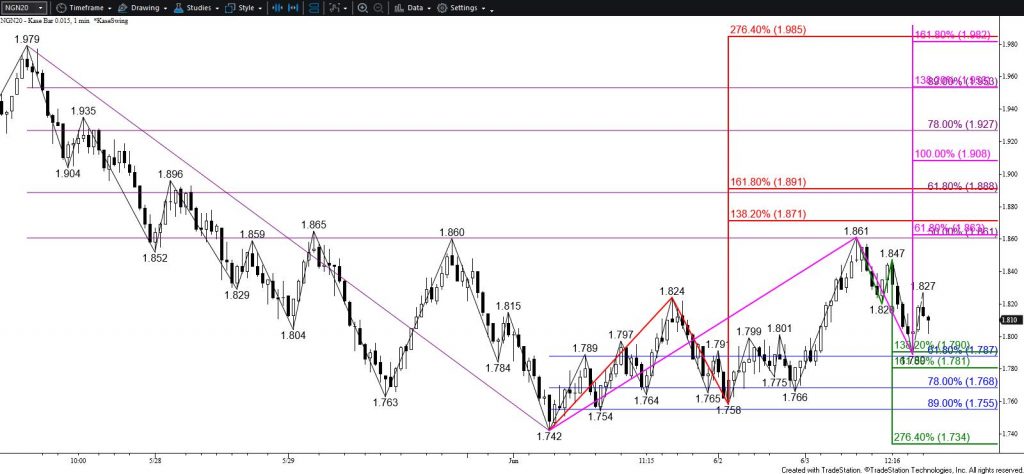
On the continuation chart, natural gas has been stuck in a wide trading range since mid-January. This range will likely persist for at least another few weeks. However, the July natural gas chart is in a downtrend that favors a decline to $1.70 during the next couple of days. This will fill the $1.722 June-July rollover gap on the continuation chart and fulfill the next major targets for the waves down from $2.364, $2.027, and $1.979. Support at $1.70 is a probable stalling point due to its importance on both the July and continuation charts. Nonetheless, any move up from $1.70 will likely be corrective and a close below $1.70 will clear the way for $1.66 and lower.

There are, however, a few bullish technical factors that suggest a larger test of resistance might take place first. Today’s close above Monday’s $1.802 midpoint completed Tuesday’s morning star. Also, this afternoon’s move down held the 62 percent retracement of the move up from $1.742. Should natural gas overcome $1.86, look for a larger upward correction to challenge $1.90. The $1.90 level is expected to hold. Settling above this would call for $1.95 possibly $1.99.
This is a brief analysis for the next day or so. Our weekly Natural Gas Commentary and daily updates are much more detailed and thorough energy price forecasts that cover key natural gas futures contracts, calendar spreads, the UNG ETF, and several electricity contracts. If you are interested in learning more, please sign up for a complimentary four-week trial.


