Outlook for Natural Gas
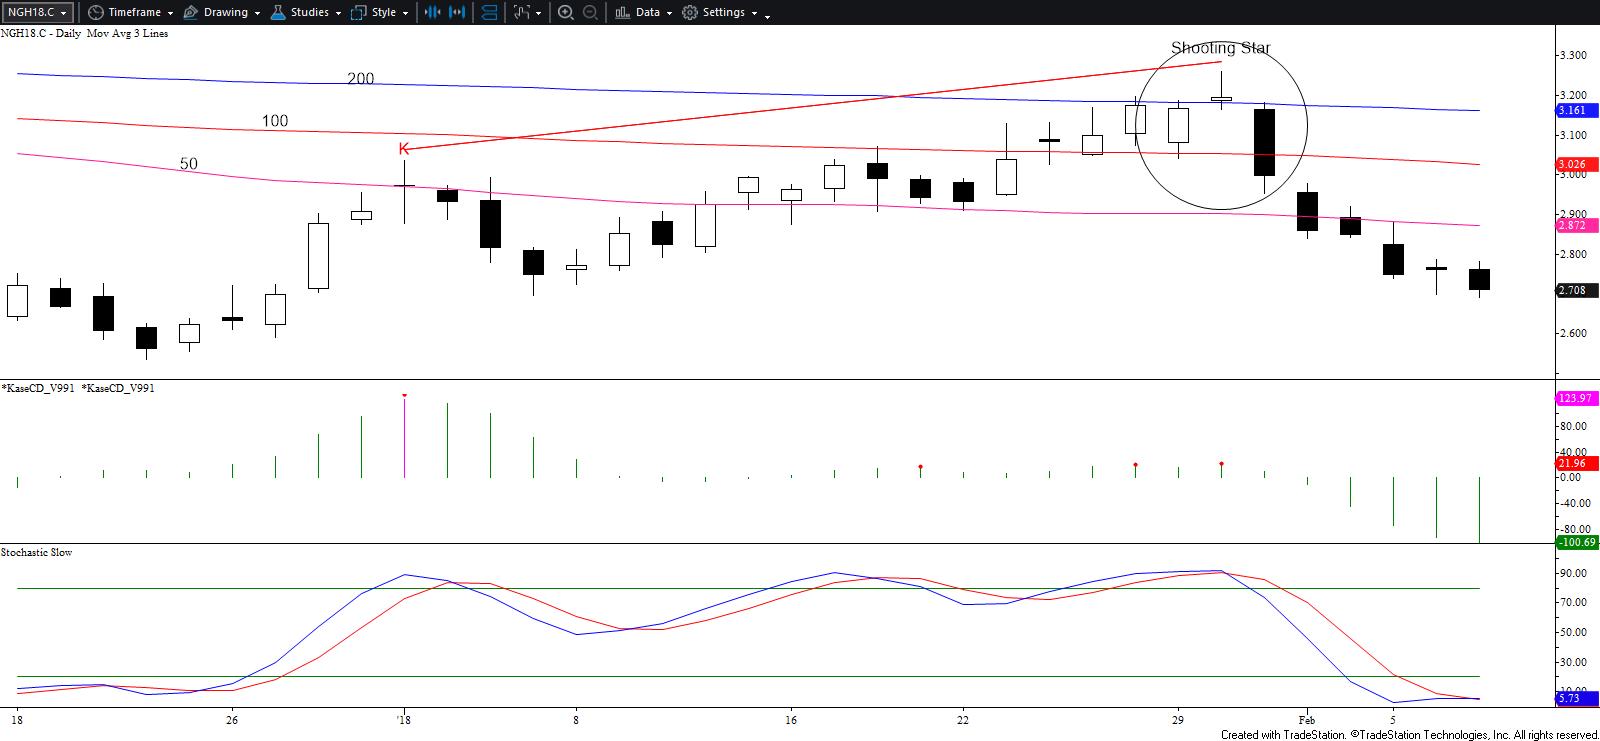
March natural gas fell below the $2.693 swing low, which nullifies the wave $2.532 – 3.035 – 2.693 and any potential that the move up from $2.532 would extend as a five-wave pattern. Today’s decline also wiped out the yesterday’s bullish hammer and intra-day bullish divergences. Therefore, as of this afternoon, there is no technical evidence that the move down will stall before reaching at least $2.65.
The $2.65 objective is the smaller than (0.618) target of the waves $3.259 – 2.837 – 2.92 and $2.92 – 2.695 – 2.782. Settling below $2.65 will open the way for $2.60 and more likely $2.56, which then connects to $2.50. The connection between these targets is of utmost importance. A move to $2.50 would take out the continuation chart’s $2.522 swing low and confirm a long-term bearish outlook.

If there is anything positive that can be said, the wave structure down from $3.259 still lacks depth. So far, all of the upward corrections have been less than 21 percent retracements. There is no guarantee that an upward correction will take place, but daily momentum is reaching oversold territory.
For now, look for initial resistance at $2.76 and $2.82. The higher of these should hold as it is the 21 percent retracement of the decline from $3.259 and the 62 percent retracement from $2.92. Key resistance is $2.87, the 50-day moving average. A close above this would indicate the move down has stalled and could be an early indicator of consolidation before the decline ultimately continues.
This is a brief analysis for the next day or so. Our weekly Natural Gas Commentary and daily updates are much more detailed and thorough energy price forecasts that cover key natural gas futures contracts, calendar spreads, the UNG ETF, and several electricity contracts. If you are interested in learning more, please sign up for a complimentary four-week trial.


