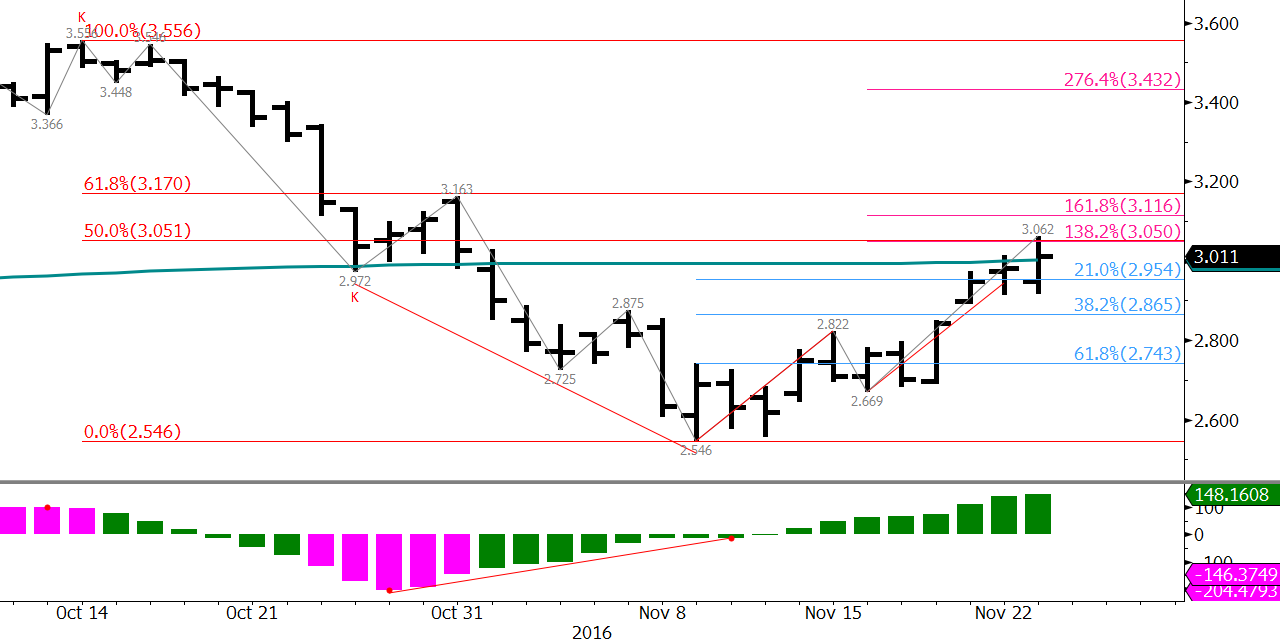
Natural gas’s recovery from recent lows is reportedly due to forecasts for cooler temperatures that could bring more demand in coming weeks. In addition, prices were bolstered on Wednesday due to a surprise two Bcf withdrawal reported in the EIA Natural Gas Storage Report. However, some analysts have cited record storage levels could still ultimately be bearish for the longer-term.
On Monday, December natural gas formed a potential bullish breakaway gap from $2.852. Bullish breakaway gaps occur when a move down becomes exhausted and prices break higher out of a recent trading range. This is a reversal pattern that could indicate the move down is over, for now.

In addition, the 200-day moving average was overcome on Wednesday when December settled at $3.026. This is also bullish and indicates, at a minimum, that an extended upward correction to challenge recent swing highs is likely underway.
The wave formation up from $2.546 met important resistance at $3.062 on Wednesday. A small correction might take place first, but the wave formations are poised for $3.17. This is key resistance because it is in line with the $3.163 swing high, which is also crucial on the continuation chart. It is also the 62 percent retracement of the decline from $3.556 to $2.546. A move above $3.17 ($3.31 for January) is doubtful without help from external factors (i.e. cold weather) but would open the way for new 2016 highs.
That said, December may still try to fill the gap from $2.852. Look for initial support at $2.95 and key support at $2.85. The $2.85 level is not only in line with the gap, but also the 38 percent retracement of the move up from $2.546.
This is a brief natural gas forecast for the next day or so. Our weekly Natural Gas Commentary and intra-week updates provide a much more detailed and thorough analysis. If you are interested in learning more, please sign up for a complimentary four-week trial.


