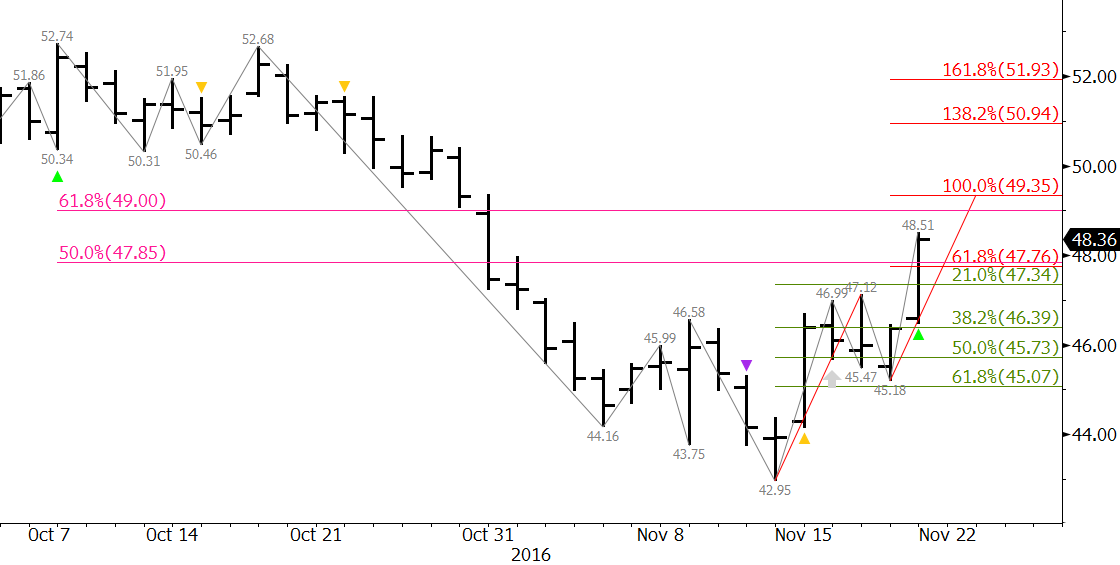
The rise in crude oil prices last week was reportedly due to increased hopes that major producers will reach an agreement to cut production. However, others’ skepticism about such a cut, the surging U.S. dollar, and a surprisingly large increase in U.S. oil supplies are said to have kept a lid on the move up so far.
On Monday, January WTI settled above the 50 percent retracement of the decline from $52.74 to $42.95 and the 0.618 projection of the wave $42.95 – 47.12 – 45.18. January also settled above the midpoint of the week ended November 4. In addition, KaseX, which uses a combination of Kase StatWare signals, triggered a buy signal (green triangle).

The move up is now in position to challenge key resistance at $49.1. This confluence point is near the 62 percent retracement of the decline and the 1.00 projection of the wave up from $42.95. It is also just above the open for the week ended November 4.
The confluence and importance of resistance around $49.1 make it a potential stalling point. However, a sustained close over $49.1 would indicate a more substantial correction and potential recovery to challenge recent highs is underway.
Initial support is near Monday’s $47.5 midpoint and the 21 percent retracement of the move up from $42.95. This level should hold. Key support for the next few days will be $46.5. This is near Monday’s open and the 38 percent retracement. A close below $46.5 would indicate the corrective move up is over and that another test of major support is about to take place.
This is a brief analysis and outlook for the next day or so. Our weekly Crude Oil Commentary and intra-week updates are a much more detailed and thorough energy price forecast. If you are interested in learning more, please sign up for a complimentary four-week trial.


