Natural gas was spurred higher last Thursday after government data showed a smaller than expected build for the week ended October 7. However, the move’s strength and resilience reportedly came as a surprise for many market participants due to mild weather across most of the U.S. The market remains well supplied according to many analysts and rig counts have begun to climb. The natural gas rig count expanded by 11 last week, which is the largest increase since late 2014.
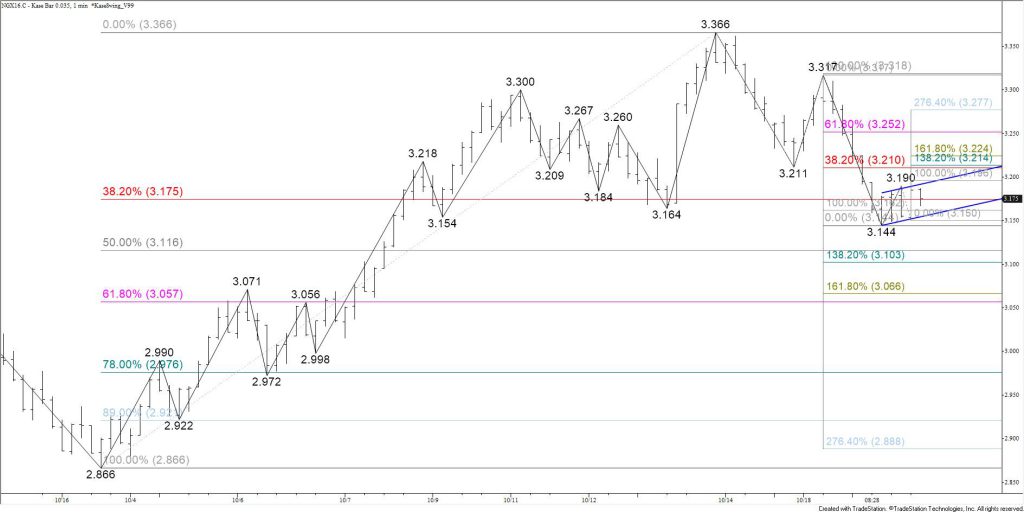
This week, November natural gas prices have fallen to $3.144 so far and settled below major support at $3.21 on Wednesday. The move down stalled just before reaching the next target at $3.12.
The subsequent move up from $3.144 has been shallow, choppy, and is forming a bearish flag. Bearish flags are reasonably reliable patterns that indicate the market should continue to decline. The lower trend line of the flag is $3.15 and the upper trend line is $3.21. The $3.21 level may be tested first but should hold because odds favor a break lower out of the flag.

Tomorrow, look for prices to break lower out of the flag and fall to at least $3.12. A close below this would call for $3.06. For the move up to continue in the near-term, $3.06 must hold. This is the 62 percent retracement of the move up from $2.866 to $3.366. A close below $3.06 would shift odds in favor of testing the $2.866 swing low.
Conversely, a break higher out of the flag and close over $3.21 would call for $3.27 and $3.32. A move above $3.32 would take out the wave down from $3.366 that projects to $3.06 and lower.
This is a brief natural gas forecast for the next day or so. Our weekly Natural Gas Commentary and intra-week updates provide a much more detailed and thorough analysis. If you are interested in learning more, please sign up for a complimentary four-week trial.


