WTI has primarily risen on the momentum created by the tentative agreement between OPEC members to cut production by 200,000 to 700,000 barrels per day in coming months. The details of such a deal are still being ironed out and would have to be ratified at OPEC’s meeting in November.
Some traders and analysts reportedly believe that the bullish sentiment from the OPEC announcement is now priced into the market and that further external catalyst is necessary to push prices higher. WTI showed signs of exhaustion last week. However, prices were boosted by an unexpected decline in U.S. crude oil inventories late in the week and rose to $51.6 on Monday.
OPEC detractors remain skeptical because much of the world’s oil is now produced outside of the cartel. Many pundits believe that it will take more than OPEC cuts to stabilize oil prices. To that end, Saudi Arabian and Russian officials are set to meet in Istanbul this week to discuss such matters. However, several reports indicate comments made by Russia’s energy minister dampened hopes that an agreement would be reached during their meeting.
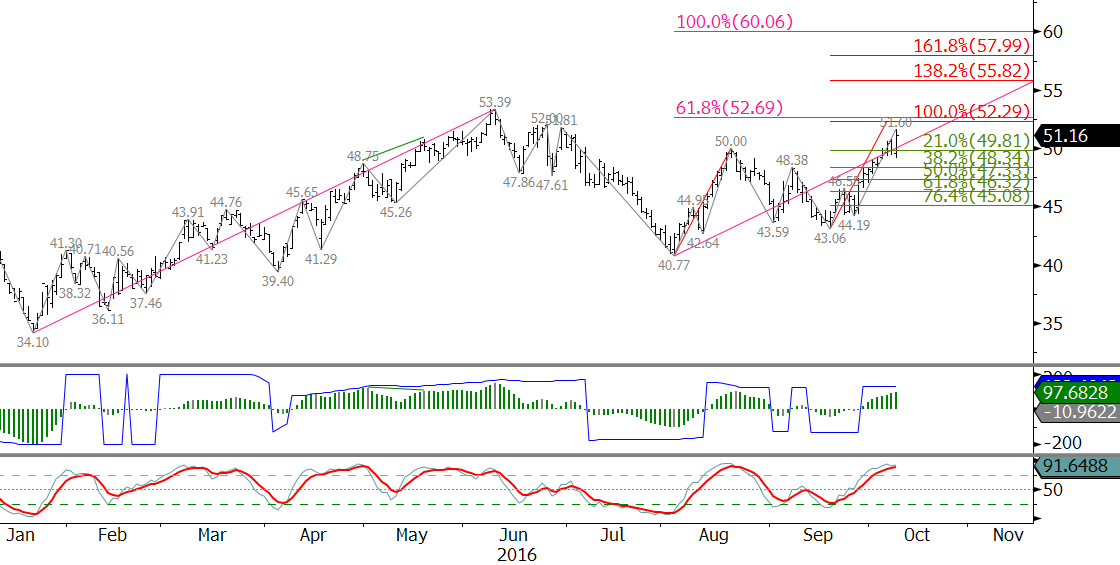
The technical outlook for WTI is bullish, but there have been a few signs of weakness. The recent wave formation up from $43.06 is overextended, the Stochastic is overbought, and most momentum indicators are setup for daily bearish divergences. Although there is no definitive technical evidence the move up will stall, a correction should take place soon.
November is approaching key resistance at $52.6. This is the point at which the wave formation up from contract low connects with the wave up from early August’s low. $52.6 is the 0.618 projection for the wave $34.1 – 53.39 – 40.77 and the 1.00 projection for the wave $40.77 – 50.0 – 43.06. A close over $52.6 would open the way for a longer-term bullish outlook with targets in the upper $50s and low $60s. WTI should rise to $52.6. However, given the importance of this level, we expect to see a correction before $52.6 is overcome.

Should prices turn lower before rising to $52.6, look for initial support at $50.5 and then $49.6. A close below the latter would call for an extended correction to $48.3. A normal correction should hold $48.3 because it is the 38 percent retracement of the move up from $43.06. A close below this would call for a more substantial correction before the move up continues.
This is a brief analysis and outlook for the next day or so. Our weekly Crude Oil Commentary and intra-week updates are a much more detailed and thorough energy price forecast. If you are interested in learning more, please sign up for a complimentary four-week trial.


