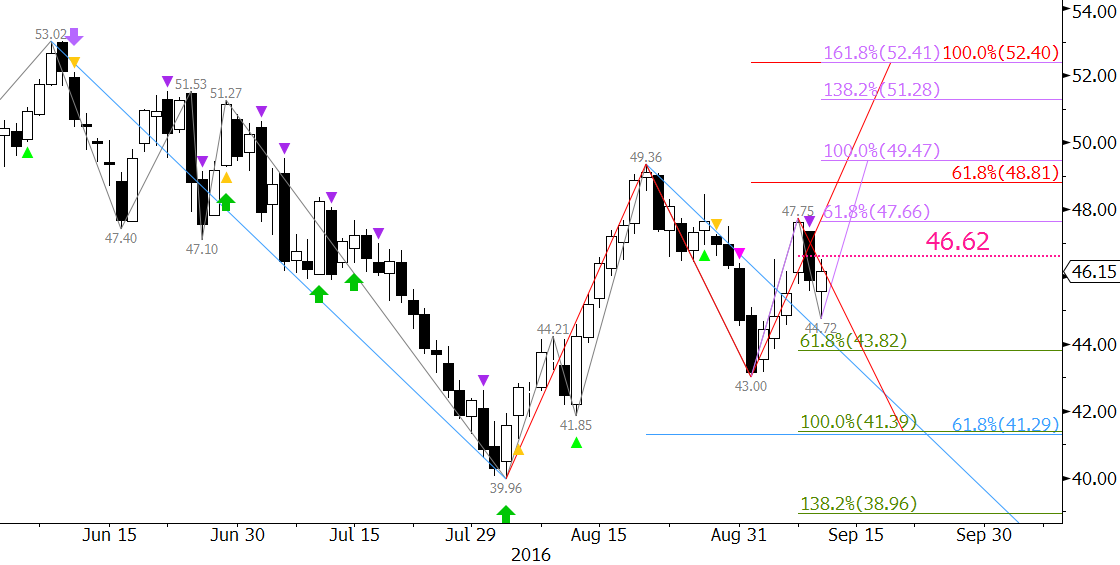
Charts tell us what the market knows about itself, and right now, WTI crude oil is confused. There are many competing fundamental, technical, and geopolitical factors in play at the moment. Therefore, no one factor has a clear and decisive edge over the others.
October WTI is oscillating in a corrective range and will most likely continue to do so until there is a sustained close over $52.4 or below $41.3. These are the points at which the larger scale wave projections up from $39.96 and down from $53.02 merge with the most recent projections up from $43.0 and down from $49.36, respectively.

These waves also show how the connections are made to the important $52.4 resistance and $41.3 support levels.
The longer-term favors a move up, but in the near-term look for a test of at least $43.8 first. A close below this would call for $41.3. A sustained close below $41.3 is doubtful without help from external factors, but would call for a longer-term bearish outlook.
Should October WTI close over $46.6, near-term odds would shift in favor of $47.7, which is the 0.618 projection of the wave up from $43.0. This wave makes a connection from $47.7 to $49.5 and ultimately $52.4. A sustained close over $52.4 would call for the bullish move up to extend to new highs for 2016.
This is a brief analysis and outlook for the next day or so. Our weekly Crude Oil Commentary and intra-week updates are a much more detailed and thorough energy price forecast. If you are interested in learning more, please sign up for a complimentary four-week trial.


