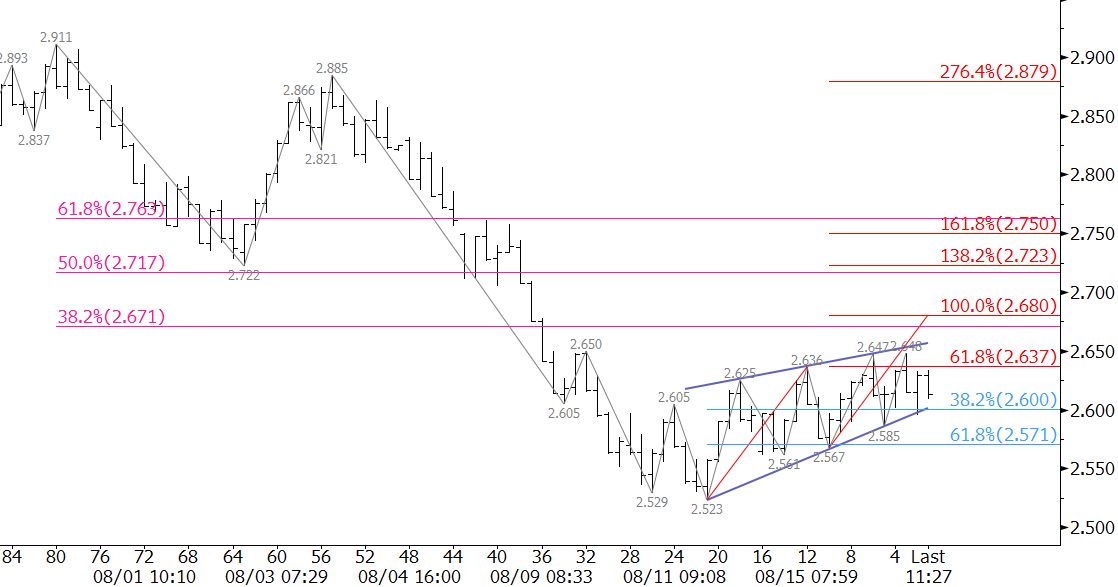
Late last week, September natural gas fulfilled important support near $2.51 when prices fell to $2.523. This is the 1.00 projection of the wave down from $2.99, the 50 percent retracement of the move up from $2.009, and the 62 percent retracement from $2.195. The confluence of targets around $2.51 indicate it is a potential turning point for natural gas.
Prices have risen from $2.523 to $2.648 so far, but the move has been extremely choppy and shallow. As a result, the move is most likely corrective. This is accentuated by the formation of a bearish pennant on the intra-day charts. Pennants are continuation patterns that indicate the prior trend should continue. In this case, the pennant favors a break lower. A close below $2.57 would confirm the break lower out of the pennant and open the way for another test of key support at $2.51.

September natural gas has worked its way to important resistance at $2.64, but has not been able to close over this level yet. $2.64 is the 0.618 projection of the primary wave up from $2.523. A close over $2.64 would call for key resistance at $2.68. The $2.68 level is near the 38 percent retracement of the move down from $2.911 and is the midpoint of last Tuesday’s candlestick. A close over $2.68 would be a strong indication that prices will settle back into a trading range.
It is a tight call right now, but until there is a close over $2.68, odds favor a continued decline.
This is a brief natural gas forecast for the next day or so. Our weekly Natural Gas Commentary and intraweek updates provide a much more detailed and thorough analysis. If you are interested in learning more, please sign up for a complimentary four-week trial.


