 by Cynthia Kase
Read on TraderPlanet
“Ask Kase” and your question may be chosen as the subject of a future column (askkase@kaseco.com).
With VW cheating on diesel fuel emissions and standards being scrutinized worldwide, interest in electric vehicles may increase longer-term, and medium-term, gasoline fueled vehicles might pick up. But will gasoline prices get a boost any time soon? Probably not.
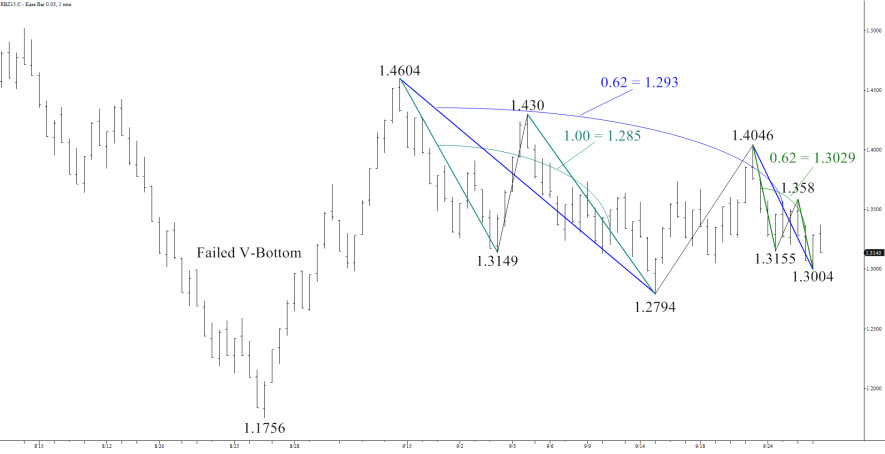
December gasoline, which becomes prompt in two days, traded up to $1.4604 at the end of August. Since then it’s been caught in a downward oscillating pattern, but remains above its earlier $1.1756 low.
Odds favor the downside. This was a large down month which prevented a bullish reversal pattern from completing. On the daily chart, the decline to and bounce up from $1.1756 was a bullish V-bottom but failed. The decline from $1.4604 was interrupted by a bullish flag which has since broken lower. The perpetual has been steadily dropping since mid-June, only going into a sideways stall during the past two weeks.

Charts created using TradeStation. ©TradeStation Technologies, Inc. 2001-2015. All rights reserved. No investment or trading advice, recommendation or opinions are being given or intended.
Odds of a recovery are higher than for a normal trending market. The decline from $1.4604 only met the minimum 0.62 extension. The decline has also been shallow.
Two very strong layers of support are $1.235 and $1.205, respectively the 78 percent and 89 percent retracements of the $1.1756 to $1.4604 rise. $1.235, less than one cent above the perpetual’s January low, is important because it’s only generated by the waves down from $1.4604. For the six waves down from this price, $1.235 is a wave extension for five, and as a corrective projection for three. Thus, should $1.235 hold, there is no connection to larger, earlier waves which project to lower levels. The next layer at $120.5 connects back to the mid July $1.5828 high. This support level could engender a trading range between the $1.20s and $1.50s, so watch out for that.
Even though the previous low of $1.1756 is natural support, a close below $1.205 could trigger a steep decline down to $1.06. This is because the wave extensions tie the two prices together. The wave 158.28 – 117.56 – 146.04 targets $1.205 as the 0.62 extension and $1.06 as the equal, 1.0, extension. 140.46 – 130.04 – 133.73 targets $1.205 as the 1.38 extension and $1.06 as the 2*1.38 extension. The point is that should there be a close below $1.205, the pull from $1.06 grows.
Adding to that pull is that $1.06 is the 89 percent retracement of the move up from the 2008 low of $0.785 to 3.48. Hitting $1.06 could cause a slide below the $1.00 level.
So watch to see if the two targets in the $1.20s hold – or not.
A close over $1.375 would argue for concern that the move up from $1.1756 will extend. That’s the price above which I wouldn’t hold short-term short position. Above $1.4604 the contract is in for a further recovery. Either way, moderate prices, well below prices should prevail. So fill up the tank, and get on the road before December snows slow you down!
Send questions for next week to askkase@kaseco.com, and click the link to learn more about Cynthia Kase’s latest video series, Kase on Technical Analysis.

