Read on TraderPlanet
As a fledgling oil trader over 32 years ago, the one exchange with which I was familiar was NYMEX, now part of CME Group. So I’m always interested in how the exchange is doing. With erratic swings in equity, fixed income, and FOREX markets, some think investors will increasingly use the CME to manage risk and take advantage of bear markets.
CME Outlook
Let’s see what the charts have to say about this transaction volume, as opposed to price driven, market.
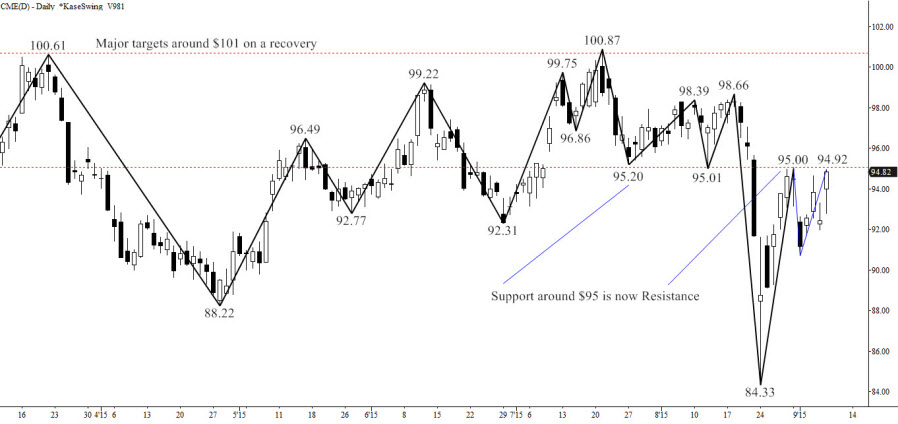
As August closed, CME had hit $95, retracing 62 percent of the decline from $100.87 to $84.33. Tuesday, CME made a $94.92 high, closing just 10 cents below that – the highest close since $84.33.
 Charts created using TradeStation. ©TradeStation Technologies, Inc. 2001-2015. All rights reserved. No investment or trading advice, recommendation or opinions are being given or intended.
Will the current modest recovery hold below its 62 percent retracement, or continue higher? The call is not clear, but my bias is higher with the proviso that CME must close and remain over $95.2 soon.
CME Technical Analysis
Here are the technical reasons:
- The trend terminus (Y3/X2) for the first wave down, 100.87 – 95.01 – 98.661, calculated to $84.30. $84.33 was hit, fulfilling the target almost exactly.
- The market gapped down on the August 24 open, before meeting $84.33. This could be an exhaustion gap.
- The daily candlestick for August 24 was a bullish “hammer”.
- Together with the prior day, August 21, the hammer comprised a “morning star” setup, completed by a close over the August 21 midpoint.
- The low on August 24 generated an oversold signal.
- Every downside test generated by small down gaps has failed.
- Tuesday importantly closed over the midpoint of the very bearish week ending August 21.
The reason $95.2 is critical, in addition to being just over the 62 percent retracement, and the midpoint for the bearish week, is that it is structural resistance and previously support as shown on the chart. $95 is also the critical daily Kase DevStop3. So, a close over will mean, per statistical testing, odds for a close over $100 are 70 percent.
The next threshold is $97.5, confluent for the wave 84.33 – 95.00 – 90.68, as the 0.62 extension and Phi corrective projection. It is a key target for the smaller waves following, and the open of the big down week noted above. Once $97.5 is hit, a trading range could ensue, but it would not be surprising to see $100.87 tested, and even new post-recession highs made. If I were short, I’d certainly scale out on closes in the $95.2 to $97.5 range.
Recommended CME Trading
The big bearish factor is that $95 has not yet been overcome. If I were long, I’d begin to lighten up at $90, and become more aggressive below $86 and out by. Playing from the short side, I’d be emboldened below $90, and looking for confirmation at $86.5 and $82.6. The “settlement” on CME isn’t in yet, but odds are leaning towards some moderation to the upside. For the CME no “exchange” just yet.

 By
By 